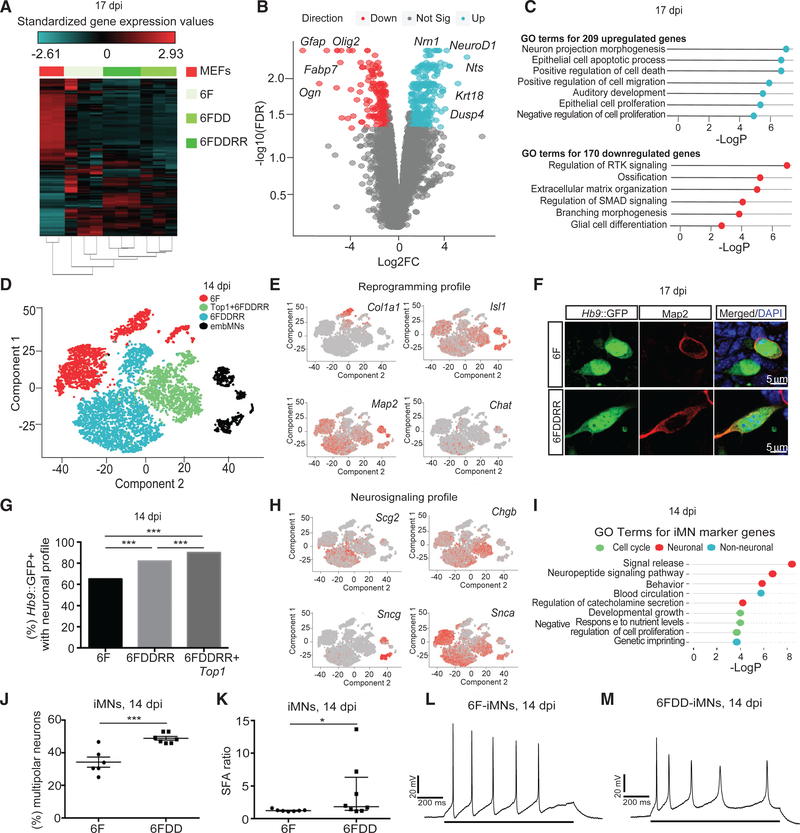
Figure 6. Converting HHCs Adopt the Induced Motor Neuron Transcriptional Program and Accelerate Morphological Maturation.
(A) RNA-seq heatmap for Hb9::GFP+ cells at 17 dpi from different conditions compared to starting MEFs across the 1,186 genes that are differentially expressed between MEFs and Hb9::GFP+ cells. n = 3 independent conversions per condition.
(B) Volcano plot comparison of genes up- (blue) or downregulated (red) in Hb9::GFP+ cells at 17 dpi.
(C) List of gene ontology (GO) terms for genes upregulated (top, blue) or downregulated (bottom, red) in 6FDDRR cells compared to 6F at 17 dpi.
(D) tSNE projection of Hb9::GFP+ embryonic motor neurons (embMNs) collected at 12.5 dpi and iMNs generated by three different cocktails (6F, 6FDDRR, and 6FDDRR+Top1) colored by individual condition. embMNs were bioinformatically identified by Isl1 expression to distinguish from other Hb9::GFP+ populations.
(E) Relative expression colored by intensity of Col1a1, Isl1, Map2, and Chat over the populations in the tSNE in (D).
(F) Hb9::GFP+ iMNs immunostained for Map2 at 17 dpi. Scale bars represent 5 μm.
(G) Percentage of the Hb9::GFP+ cell population with neuronal gene expression profile at 17 dpi.
(H) Relative expression of neurosignaling genes (i.e., Scg2, Chgb, Sncg, and Snca) colored by intensity over the populations in the tSNE in (D).
(I) List of gene ontology (GO) terms for marker genes upregulated in iMN clusters.
(J) Percentage of multipolar iMNs derived from MEFs at 14 dpi. n = 6 or 7 independent conversions per condition. Mean ± SEM; unpaired t test.
(K) SFA ratio evoked action potentials (Aps) of mouse iMNs at 14 dpi. n = 7 or 8 cells from 3 independent conversions per condition. Median ± interquartile range is shown; Mann-Whitney test.
(L and M) Representative action potentials evoked in mouse iMNs by a positive current injection (indicated by solid bar across bottom) illustrating SFA over the course of the stimulus of iMNs in 6FDD (M) and 6F (L) conditions at 14 dpi.
Significance summary: p > 0.05 (ns); *p ≤ 0.05; **p ≤ 0.01; ***p ≤ 0.001; and ****p ≤ 0.0001.

