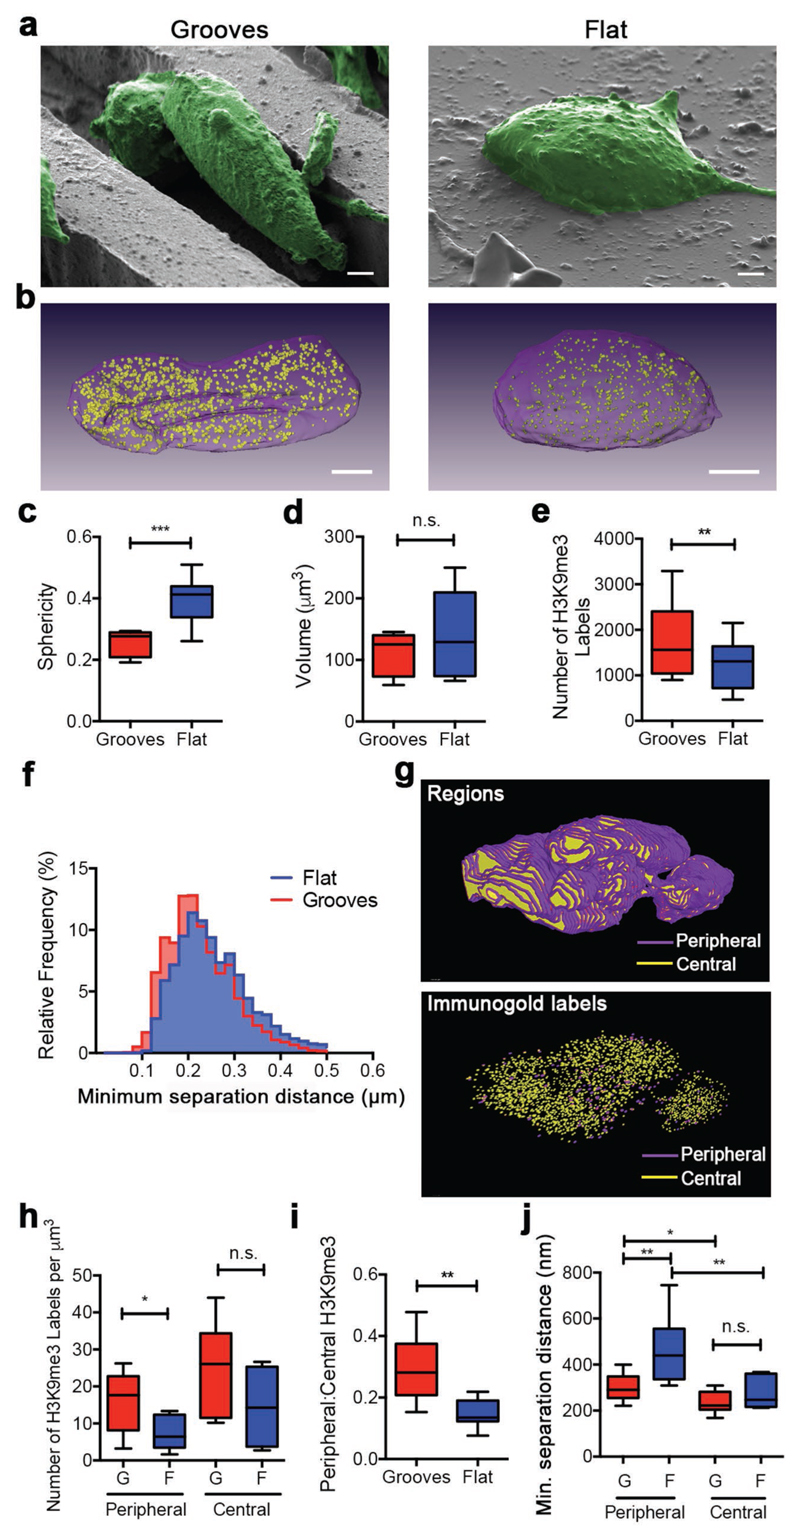
Figure 3. Immunogold FIB-SEM analysis of the epigenetic mark H3K9me3 during micro-groove-induced neuronal differentiation.
a) False-colored SEM images of cells (green) on microgrooves and flat substrates prior to milling. Scale bars = 2 μm. b) 3D reconstruction of the nucleus (purple) and H3K9me3 immunolabels (yellow) within a cell cultured on micro-grooved topography or flat PDMS substrate. Scale bars = 2 μm. c) Quantification of 3D sphericity. d) Quantification of the volume of the nuclei of cells cultured on microgrooves or flat substrates. Data presented as min-to-max plots, n = 9 (cells), *** p < 0.001, two-tailed Mann–Whitney nonparametric test. n.s. = Not significant. e) Quantification of H3K9me3 immunolabels within nuclei of cells cultured on microgrooved and flat PDMS substrates. Data presented as min-to-max plots, n = 9 (cells), ** p < 0.01, two-tailed Wilcoxon paired nonparametric test. f) Relative frequency histogram of minimum separation distance between H3K9me3 immunogold pairs in nuclei of cells on microgrooves and flat surfaces. g) Representative 3D reconstruction of the nucleus of a cell cultured on microgrooves with segmented peripheral regions (purple, up to 150 nm from the nuclear surface) and central regions (yellow). H3K9me3 immunogold labels within the same nucleus were segmented based on their positioning being either central or peripheral. h) Quantification of peripheral and centrally located H3K9me3 immunogold labels for nuclei of cells on microgrooves and flat substrates per cubic micrometer. Data presented as min-to-max plots, n = 9 (cells), * p < 0.05, two-tailed Mann–Whitney nonparametric test. n.s. = Not significant. G = Microgrooves, F = Flat. i) Ratio of peripheral-to-central H3K9me3 immunogold labels in nuclei of cells on microgrooves and flat substrates. Data presented as min-to-max plots, n = 9 (cells), ** p < 0.01, two-tailed Mann–Whitney nonparametric test. j) Quantification of minimum separation distance of immunogold labels as a function of location (periphery or center) and substrate (microgrooves or flat). Data presented as min-to-max plots, n = 9 (cells), * p < 0.05, ** p < 0.01, two-tailed Mann–Whitney non-parametric test. n.s. = Not significant. G = Microgrooves, F = Flat.

