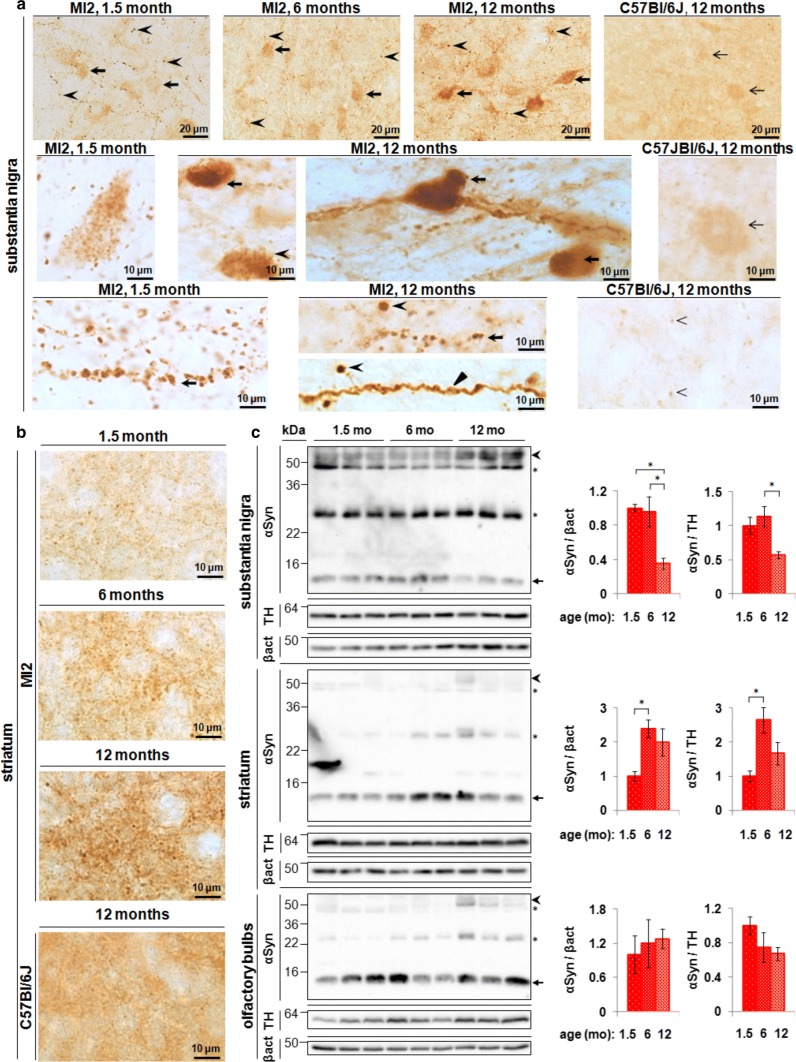
Fig. 2.
Aggregation of 1–120 hαSyn protein in MI2 mice. a Top panel: progressive accumulation of 1–120 hαSyn protein with age in SNpc of MI2 mice in cell bodies (arrows) and processes (arrowheads). Middle panel: abundant small inclusions of 1–120 hαSyn protein in SNpc cell bodies are present at 1.5 months and large, LB-like aggregates in SNpc neurons (arrows) among cells with 1–120 hαSyn punctate staining (arrowhead) are found at 12 months of age. Bottom panel: large 1–120 hαSyn puncta are distributed along the processes in SNpc at 1.5 and 12 months of age (arrows). At 12 months of age, processes uniformly filled with 1–120 hαSyn (triangle) and round inclusions containing condensed 1–120 hαSyn protein (arrowheads) are also visible. The staining of αSyn in WT C57Bl/6J mice is much less intense and more homogenous. Middle right panel: less αSyn is present in cell bodies, and no cellular inclusions are found (arrow) in control mice. Bottom right panel: αSyn puncta in the nigral processes are much less numerous and smaller in C57Bl/6J mice than in MI2 mice (arrowheads), (see also Supplementary Fig. S2, Online Resource 1). b Progressive accumulation of 1–120 hαSyn puncta in MI2 striatal neuropil in 1.5, 6 and 12 month-old MI2 mice. In 12 month-old C57Bl/6J mice striatal αSyn is distributed more homogenously and large αSyn-positive puncta are not present (bottom panel). c Immunoblotting of brain lysates from MI2 mice as a function of age. The levels of monomeric 1–120 hαSyn (~ 14 kDa, arrow) shown in the western blots were quantified and normalized to either β-actin or TH (right panels). Data are expressed as fold difference compared to 1.5 month-old animals (mean ± SEM, n = 3 mice, one-way ANOVA, multiple comparison with Bonferroni corrections). In SN, a reduction of monomeric 1–120 hαSyn was found as a main effect of age [statistically significant differences between 1.5 and 12 months and between 6 and 12 months (αSyn/β-actin or αSyn/TH; *p < 0.05)] for all comparisons. In the striatum there was a significant increase of 1–120 hαSyn between 1.5 and 6 months of age (*p < 0.05) for both αSyn/β-actin and αSyn/TH. There was no significant change in OB. In all the three brain regions increased amounts of high molecular weight (HMW) 1–120 hαSyn bands (~ 55 kDa, arrowhead) were present in MI2 mice at 12 months compared to 1.5 and 6 months of age (see also Supplementary Fig. S3, Online Resource 1). Stars denote the non-specific bands recognized by Syn1 antibody in both MI2 and αSyn-null C57Bl/6S mice [29] (see detailed statistical evaluation in Online Resource)

