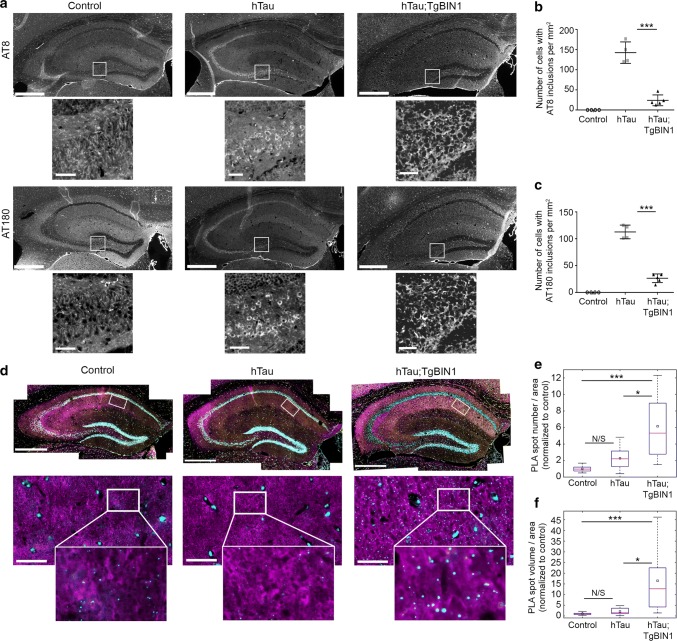
Fig. 2.
BIN1 overexpression prevents Tau inclusions and increases BIN1–Tau interaction in hTau hippocampi. a Immunohistofluorescence of different phospho-Tau proteins in hippocampi of control, hTau and hTau;TgBIN1 males at 18 months. Antibodies used were detecting p-Ser202/p-Thr205 Tau (AT8) or p-Thr231 Tau (AT180). Insets show zooms of the hilus areas encompassing the neuronal cell bodies; intracellular inclusions are visible for hTau, but barely for hTau;TgBIN1. Scale bars = 500 µm; insets, 50 µm. b, c Quantification of the number of cells with intracellular Tau inclusions per mm2 in control, hTau and hTau;TgBIN1 mice labeled with the two phospho-Tau antibodies (control, n = 4; hTau, n = 4; hTau; TgBIN1, n = 5). d BIN1-Tau PLA (cyan), and BIN1 (yellow), Tau (magenta), and Hoechst (white) stainings in the hippocampi of the same mice. Zoomed areas show PLA and Tau channels only. See Fig. S18 for Tubulin-Tau PLA, conducted as technical control. e, f Quantification of BIN1-Tau PLA density. Data expressed as PLA spot number per tissue area (E) or total PLA spot volume per tissue area (F), normalized with control mean (control, n = 9; hTau, n = 11; hTau;TgBIN1, n = 12 hemispheres for spot number; control, n = 10; hTau, n = 12; hTau;TgBIN1, n = 12 hemispheres for volume). Red bars and black squares indicate sample median and mean, respectively. Kruskal–Wallis ANOVA, followed by multiple comparisons test with Tukey–Kramer correction; ***p < 0.0001; *p < 0.05. N/S not significant. Scale bars = 500 µm; zooms, 50 µm

