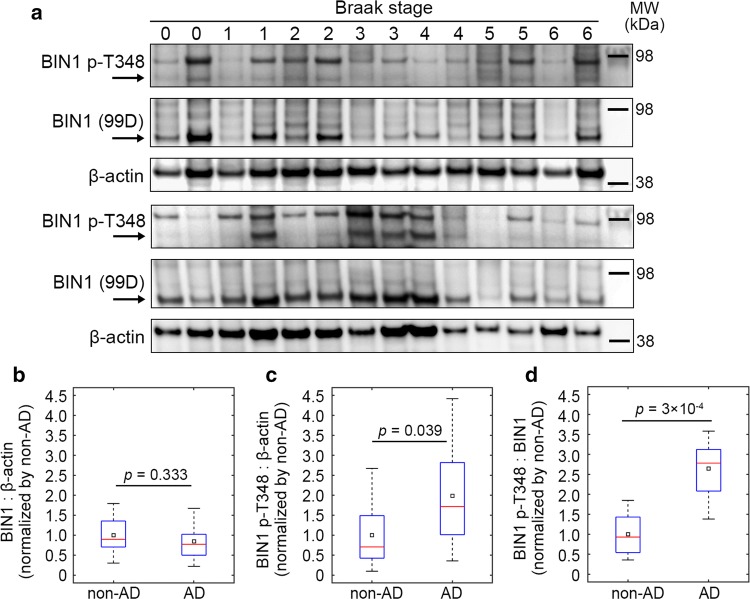
Fig. 6.
BIN1 amount and phosphorylation status in post-mortem AD brains. a Western blots showing total BIN1 (99D antibody), BIN1 phosphorylated at T348 (p-T348), and β-actin in the temporal lobes of 28 individuals with increasing neurofibrillary pathology (Braak stage; see Table S3 for demographic details and pathological statuses). b–d Comparison of BIN1:β-actin, BIN1-p-T348:β-actin, and BIN1-p-T348:BIN1 signals between non-AD and AD cases. Red bars and black squares indicate sample median and mean, respectively; p values refer to the Wilcoxon rank-sum test. 10 controls and 18 AD cases. See Fig. S26 for uncropped immunoblots and an analysis of the same data after stratification based on Braak stage

