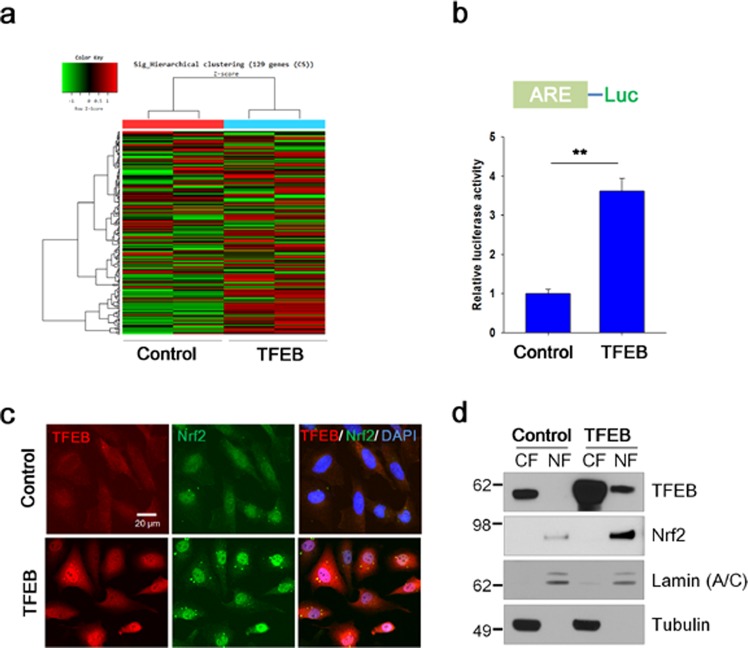
Figure 1.
TFEB increases the transcriptional activity and the nuclear localization of Nrf2. (a) The gene expression levels in H4 cells (Control) and H4 cells stably expressing TFEB (TFEB) were analyzed using cDNA microarray as described in Methods. Heat map shows the expression levels for Nrf2-response genes. Shades of red represent up-regulation, and shades of green represent down-regulation. (b) H4 cells (Control) and H4 cells stably expressing TFEB (TFEB) were transiently transfected with the ARE-Luc reporter plasmid and assayed for the luciferase activity. (c) H4 cells stably expressing TFEB fixed with 4% paraformaldehyde were immunostained using anti-TFEB and Nrf2 antibodies. Fluorescence signals were observed using a fluorescence microscope. (d) Nuclear (NF) and cytosolic (CF) fractions from control and TFEB cells were prepared as described in Methods. The cellular locations of TFEB and Nrf2 were analyzed by immunoblotting using anti-TFEB and Nrf2 antibodies, respectively. To examine the purity of the fractionations, the blot was probed with antibodies to lamin (A/C), a marker for nuclear fraction, and tubulin, a marker for cytosolic fraction. Full blots are provided in Supplementary Fig. S10. Data shown are mean ± S.E. of four independent experiments and were analyzed using Student’s t test. (**p < 0.01).

