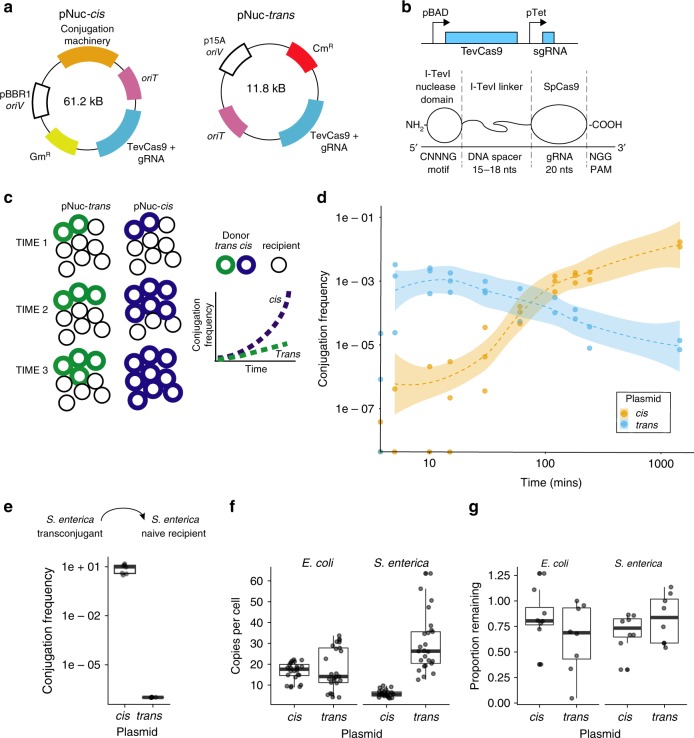
Fig. 1.
Impact of cis or trans localization of conjugative machinery on conjugation frequency. a Schematic view of the pNuc-cis and pNuc-trans plasmids. oriT conjugative origin of transfer, oriV vegetative plasmid origin, GmR gentamicin resistance gene, CmR chloramphenicol resistance gene, TevSpCas9/sgRNA coding region for TevSpCas9 nuclease gene and sgRNA. Conjugative machinery, genes required for conjugation derived from the IncP RK2 conjugative system. b (Top) The TevSpCas9 and sgRNA cassette (not to scale) highlighting the arabinose regulated pBAD and constitutive pTet promoters. (Below) The modular TevSpCas9 protein and DNA binding site. Interactions of the functional TevSpCas9 domains with the corresponding region of substrate are indicated. c Model of pNuc spread after conjugation with the cis and trans setups. Cell growth overtime will account for increase of pNuc-trans. d Filter mating assays performed over 24 h demonstrate that pNuc-cis has a higher conjugation frequency than pNuc-trans. Points represent independent experimental replicates, and the 95% confidence intervals are indicated as the shaded areas. Conjugation frequency is reported as the number of transconjugants (GmR, KanR) per total recipient S. enterica cells (KanR). e Conjugation frequency of S. enterica transconjugants harboring either pNuc-cis or pNuc-trans to naive S. enterica recipients. Data are shown as boxplots with points representing individual replicate experiments. f pNuc-cis and pNuc-trans copy number determined by quantitative PCR in either E. coli or S. enterica. Data are shown as boxplots with solid lines indicating the median of the data, the rectangle the interquartile bounds, and the wiskers the range of the data. Points are individual experiments. g pNuc-cis and pNuc-trans stability in E. coli or S. enterica determined as the ratio of cells harboring the plasmid after 24 h growth without antibiotic selection over total cells. Data are shown as boxplots with dots indicating independent experiments. Source data are provided as a Source Data file

