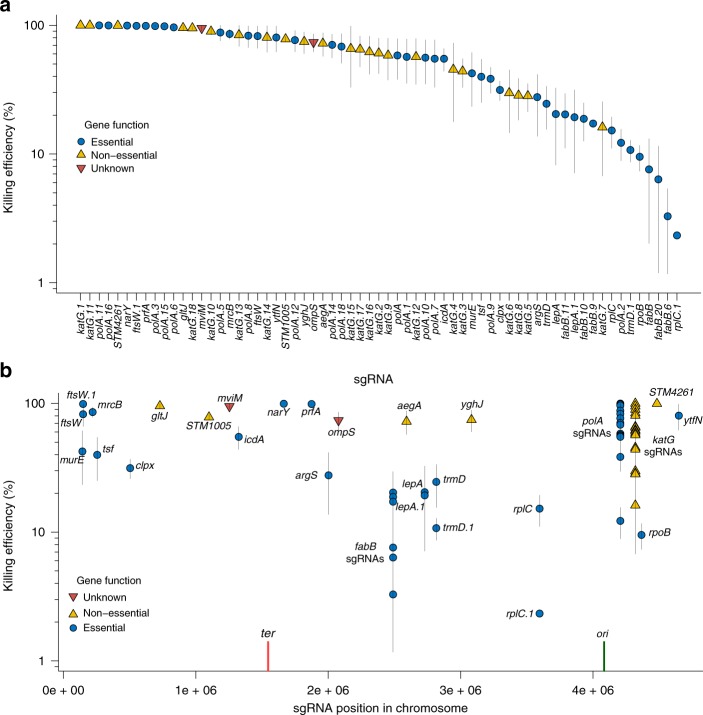
Fig. 3.
Killing efficiency of sgRNAs targeted to the S. enterica genome. a Ranked killing efficiency of individual sgRNAs coded as to whether the target site in found in an essential gene (blue filled circles), nonessential gene (orange diamonds), or unknown if the gene is essential (inverted red triangles). Vertical lines represent the standard error of the data from at least three biological replicates. b Killing efficiency of each sgRNA plotted relative to their position in the S. enterica genomes, color-coded as in panel a. The terminator region (ter) and origin of replication (ori) are indicated by vertical red and green lines, respectively. Source data are provided as a Source Data file

