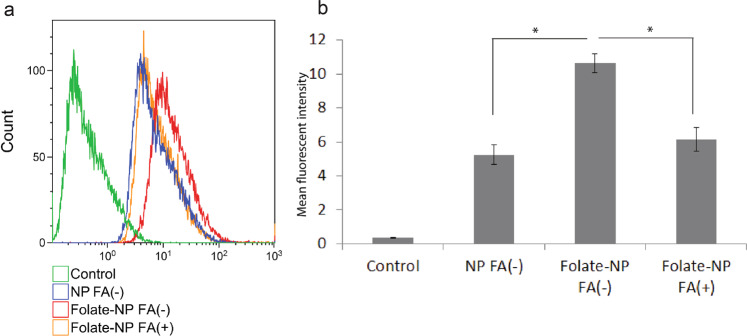
Figure 2.
Uptake of nanoparticles in macrophages studied by flow cytrometry. (a) Histogram represents the uptake of NP/Coumarin-6 and Folate-NP/Coumarin-6 by Raw 264.7 macrophages with (+) LPS stimulation (1 µg/ml) in the presence (+) or absence (−) of folic acid (FA) (a competitor). (b) The mean fluorescent intensity of cells from histogram. The data are shown as the mean ± standard deviation (n = 4), and 10,000 cells were counted. *P < 0.05.

