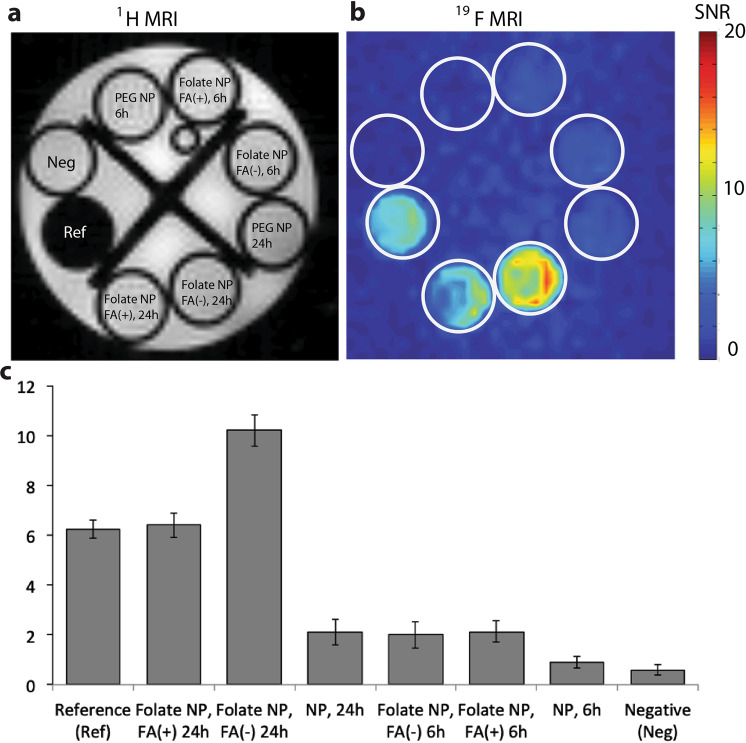
Figure 3.
Uptake of nanoparticles in macrophages studied by MRI. (a) 1H MRI and (b) 19F MRI of Raw 264.7 macrophages stimulated with LPS (1 µg/ml) in the presence (+) or absence (−) of folic acid (FA) (as competitor) and incubated with NP and Folate-NP (1 mg/ml) for 6 or 24 hours. As reference (Ref) 3.8 µmol of PFOB in CDCl3 was used. A total of 2.75 million cells were used. (c) Quantification of the 19F SNR signal shown in b. Error bars indicate SD, n = 3.

