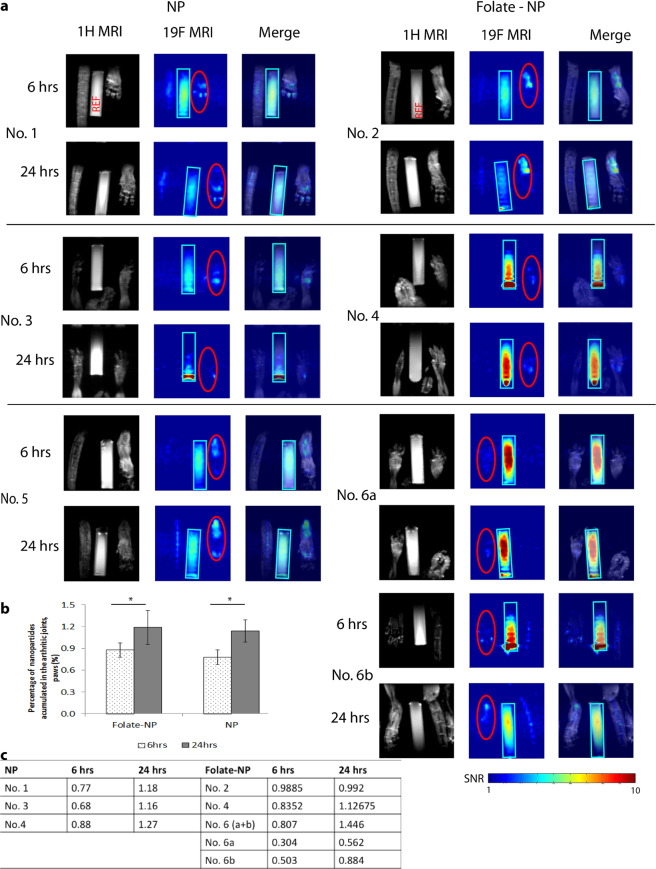
Figure 5.
Imaging of RA in mice by MRI detection. The anatomical 1H MR image (black/white color code), 19F MR image (color code) and image merge at 6 hours and 24 hours post-injection of Folate-NP or NP (a). The graph (b) represents the accumulation of nanoparticles (%) in the arthritic joints/paws. The accumulations of particle into the inflamed area were the ratios between the 19F MRI signals paws (red circle) and REF (light blue rectangular). The table (c) presents the percentage of nanoparticles that accumulated into individual arthritic paws and hinds. The data are shown as the mean ± SD (n = 3), *P < 0.05. Number 6 has two inflamed paws: front paw No. 6a and hind paw No. 6b.

