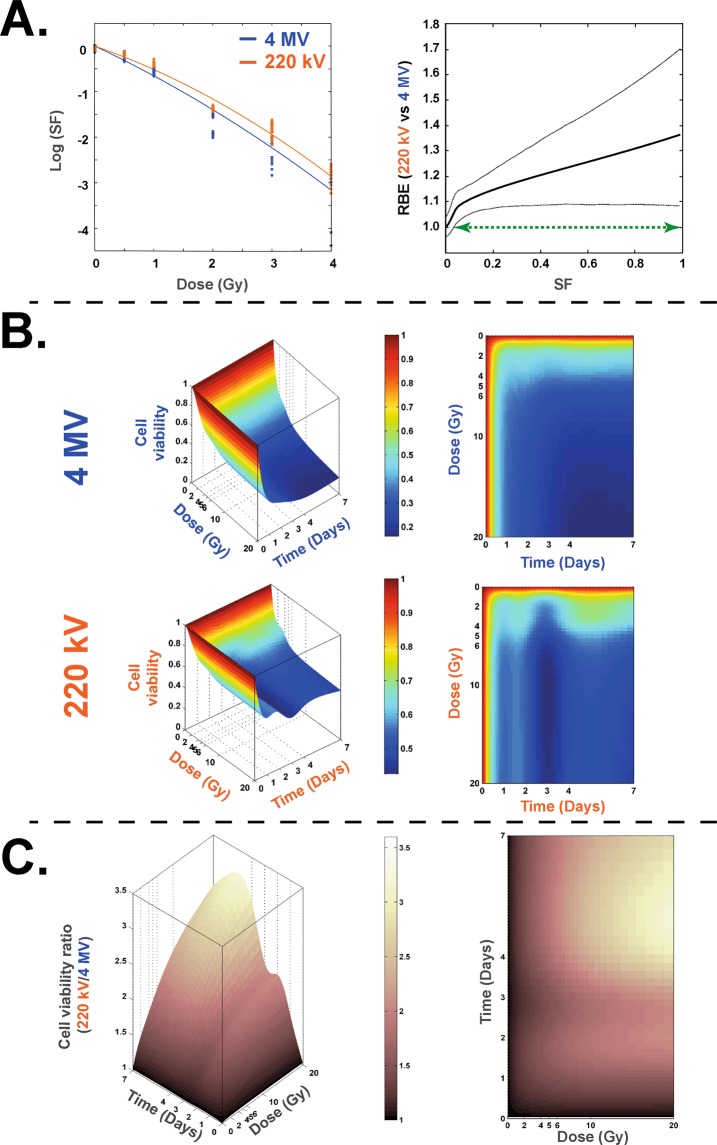
Figure 1.
Clonogenic assay and cell survival at 220 kV and 4 MV. (A) left panel: Survival fraction (SF) of HUVECs irradiated at 220 kV (orange curve) and 4 MV (blue curve). Right panel: the associated RBE curve defined as a ratio of doses for a given SF (solid line) and its associated bootstrap confidence intervals (dotted lines). The green arrow representing the range of SF wherein the value of RBE is significantly different from 1. (B) Representations of 3D and 2D curves of cell survival measures with trypan blue counting method for 220 kV and 4 MV. (C) Representations of 3D and 2D curves of cell viability ratio [220 kV/4 MV].

