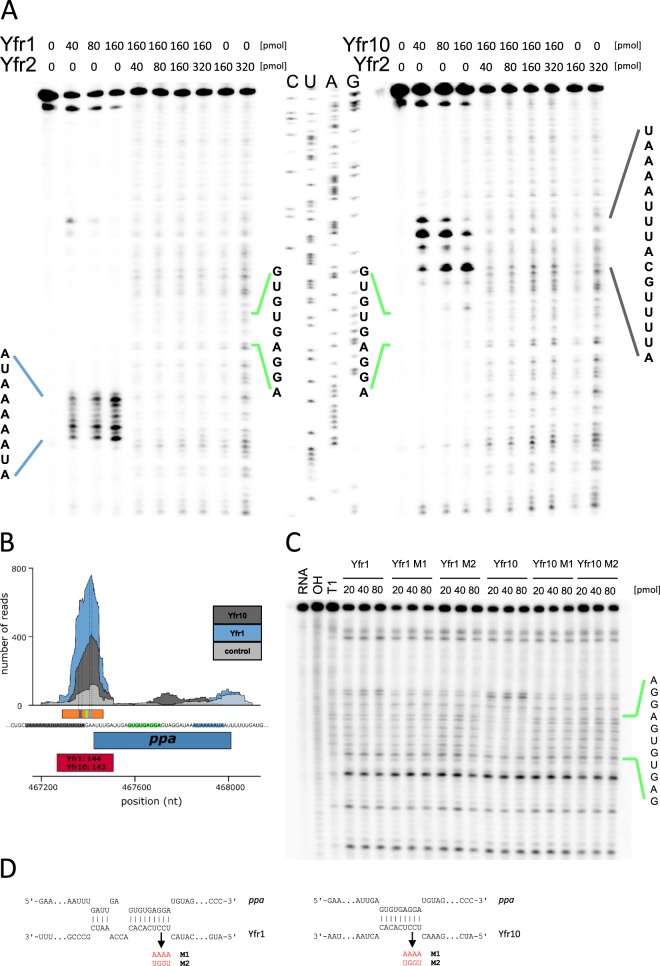
Figure 4.
Yfr2 circumvents the interaction of Yfr1 and Yfr10 with their shared target inorganic pyrophosphatase (ppa). (A) Primer extension of 0.2 pmol in vitro-synthesized 5′ region ppa mRNA in the absence of any synthesized sRNA or in the presence of varying amounts of Yfr1 (left panel) or Yfr10 (right panel) alone or with Yfr1 (left panel) or Yfr10 (right panel) combined with Yfr2. Primer extension termination signals of ppa in presence of Yfr1 or Yfr10 are denoted in blue and grey lines, respectively. The interaction region predicted by intaRNA11 is shown in green lines. (B) Read coverage plots of the Yfr10- (dark grey), Yfr1-enriched (blue) and the control library (light grey). The position of ppa is indicated by the blue box, and the numbers in red boxes correspond to the peak IDs of the Yfr1 and Yfr10 enrichment libraries shown in Tables S2 and S3, respectively. The orange box marks the region of template DNA used for primer extension. The blue and grey boxes within the orange box correspond to the observed termination sites, and the green box corresponds to the predicted interaction site in A. The vertical dashed lines mark the start and end of the termination sites. The sequence of the 5′ UTR with Yfr1 (blue) and Yfr10 (grey) primer extension termination sites, the predicted interaction site (green) and the first ATG codon of the ORF are shown. (C) RNA footprinting assays of 0.1 pmol in vitro-synthesized 5′ region ppa mRNA in the presence of increasing amounts of Yfr1, Yfr1 M1, Yfr1 M2, Yfr10, Yfr10 M1 or Yfr10 M2, respectively. The first three lanes correspond to RNA – untreated control, OH – alkaline RNA ladder and T1 – RNase T1 treated ppa in vitro transcript. (D) Interactions between ppa and Yfr1/Yfr10 predicted by intaRNA11. The arrows indicate mutations M1 and M2 (red letters).

