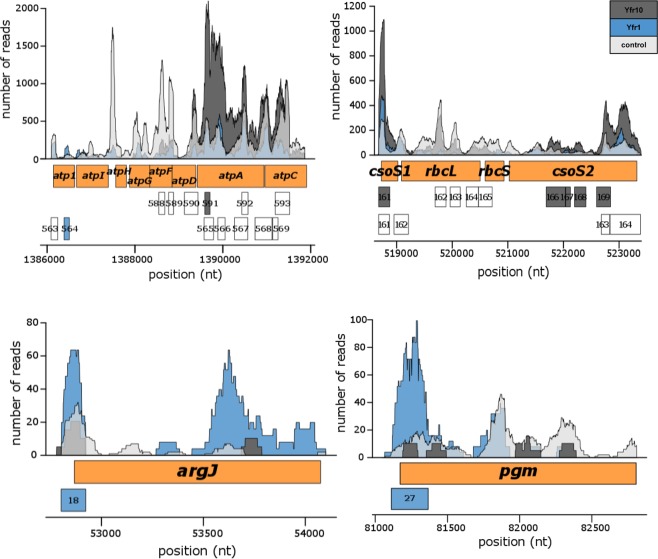
Figure 5.
Coverage plots of selected Yfr1 and Yfr10 targets discovered using the CRAFD-Seq approach. Mapped read regions of the Yfr1 and Yfr10 affinity pull-down libraries are coloured in blue and dark grey, respectively, and those of the control library are shown in light grey. The orange boxes correspond to gene positions of parts of the ATP synthase operon, the carboxysome shell polypeptides encoded by csoS1 and csoS2, the small and large subunits of Rubisco (encoded by rbcS and rbcL, respectively), argJ (encoding a bifunctional ornithine acetyltransferase/N-acetylglutamate synthetase) and pgm (encoding phosphoglucomutase). The numbers in the grey or blue boxes correspond to the peak IDs of Yfr1 and Yfr10, respectively, listed in Tables S2 and S3, respectively. White boxes correspond to called peak regions that were not enriched.

