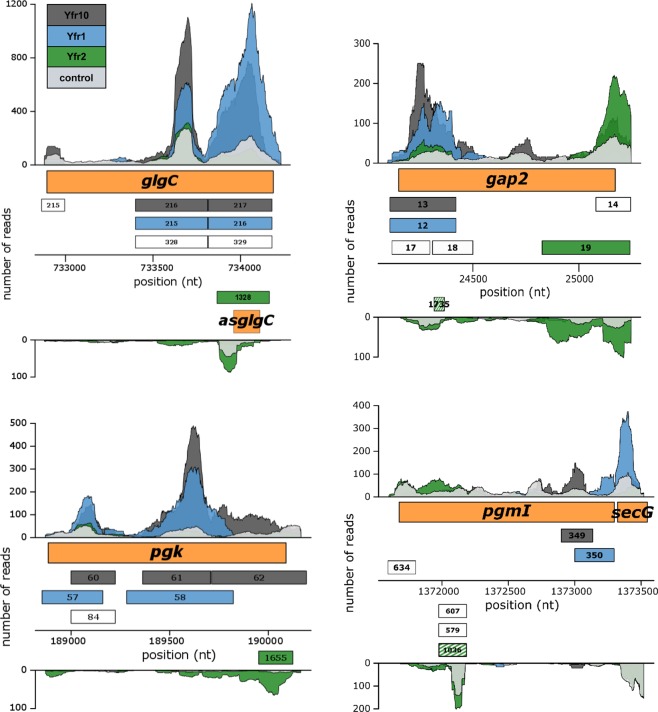
Figure 6.
Coverage plots of selected Yfr2, Yfr1 and Yfr10 targets discovered using the CRAFD-Seq approach. Mapped read regions of the Yfr2, Yfr1 and Yfr10 affinity pull-down libraries are coloured in green, blue and dark grey, respectively, and those of the control library are shown in light grey. The orange boxes correspond to gene positions of glgC (encoding glucose-1-phosphate adenyltransferase) and asglgC, gap2 (encoding glyceraldehyde-3-phosphate dehydrogenase), pgk (encoding phosphoglycerate kinase) and pgmI (encoding phosphoglycerate mutase). The numbers in the grey, blue and green boxes correspond to the peak IDs of Yfr10, Yfr1 and Yfr2 listed in Tables S1, S2 and S3, respectively. Boxes coloured in green and white stripes correspond to peak regions where only one of the duplicate libraries was more than 2-fold enriched. White boxes correspond to called peak regions that were not enriched.

