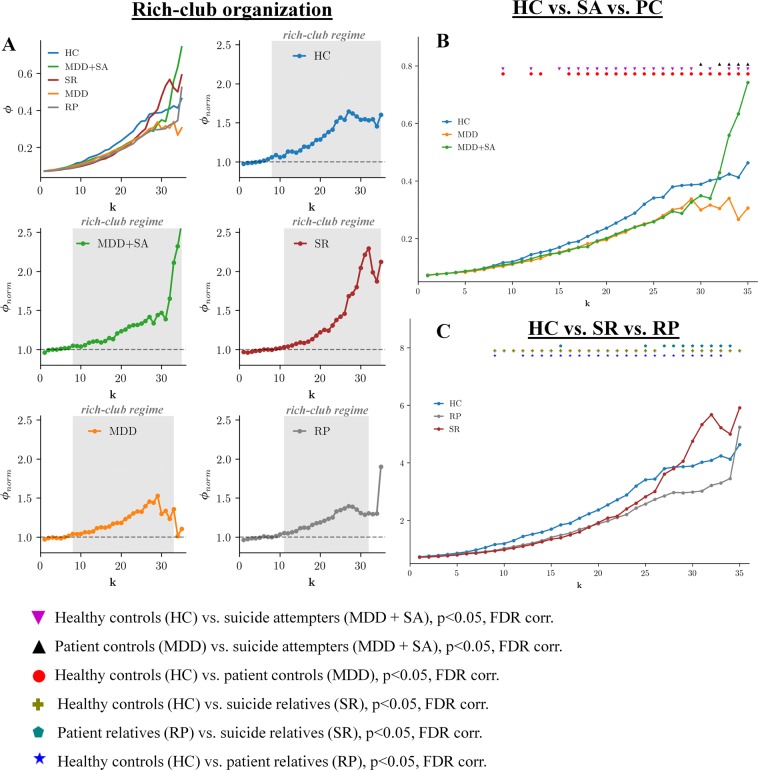
Figure 3.
Rich-club organization and between group differences in rich-club coefficients for patients and relatives. The (A) shows the rich-club coefficient values Φ(k) (k is the degree of a node) and group-specific normalized rich-club coefficient Φnorm(k) curves for the group-averaged brain network. The rich-club regime is indicated by the dark gray area, which is defined by a significant difference of Φnorm(k) from the random null distribution (permutation test, p = 0.05, Bonferroni corrected). (B,C) show significant between-group differences (as indicated by the corresponding symbols), computed for each k (permutation test). All depicted significant comparisons survived the adjusted false discovery rate (FDR) of p = 0.05.

