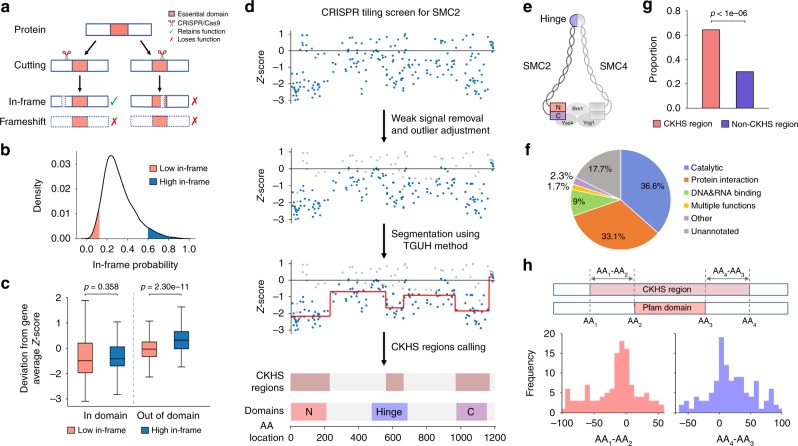
Fig. 1.
Mapping CRISPR-knockout hyper-sensitive (CKHS) regions with ProTiler. a An in-frame indel model underlying the rationale of domain-associated CKHS regions. b Distribution of in-frame probability of the sgRNAs targeting essential proteins in Munoz data. The probabilities were predicted using inDelphi11. The top 5% and bottom 5% sgRNAs are defined as high in-frame (blue) and low in-frame (red), respectively. c Box-plots comparing the dropout effects between high in-frame and low in-frame sgRNAs that target proteins containing drug target domains. The center line, bounds of box and whiskers represent the median, interquartile range and 1.5 times interquartile range, respectively. The p-values were computed using the Mann–Whitney test. d The workflow of ProTiler. The dot plots show the dropout effects, in Z-score6 (Y-axis), of sgRNAs targeting the gene coding for SMC2. A negative value of the Z-score corresponds to a dropout effect. Each dot represents an sgRNA mapped to the amino acid location (X-axis). The grey dots and blue dots represent filtered and remaining sgRNAs, respectively. The red line shows the segmented protein regions and their dropout signal levels. e A structural model of condensin complex, in which SMC2 and SMC4 form a heterodimer via hinge domains, and their ATPase head domains (N and C) are associated with kleisin subunits to create a ring-like structure. f Categorization of CKHS regions based on the molecular functions of overlapped protein domains. g A bar chart showing the proportion of AAs in Pfam domains, for CKHS regions and non-CKHS regions respectively. The p-value was empirically computed by random simulation. h Distribution of distances between the borders of CKHS regions and domain boundaries as defined in the Pfam database

