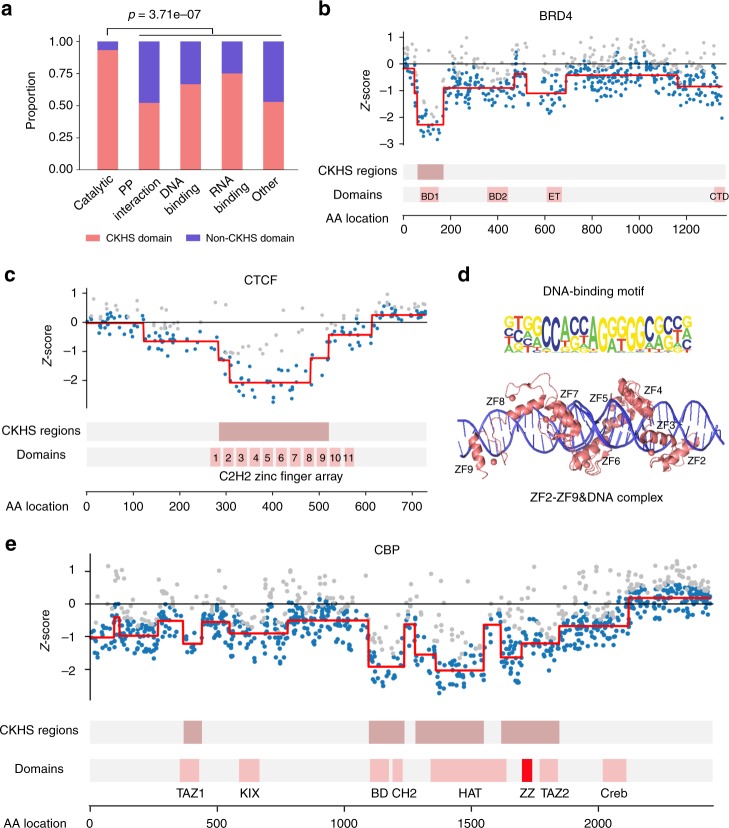
Fig. 3.
The CKHS profiles of multi-domain proteins. a All the domains in 51 multi-domain proteins were categorized based on their molecular functions. The bar chart shows the proportion of CKHS-overlapped domains for each category. The p-value was computed based on hypergeometric distribution. b The CKHS profile and domain annotation of BRD4. c The CKHS profile and domain annotation of CTCF. d The 3D structure of CTCF (ZF2-ZF9) complexed with DNA (PDB IDs: 5UND;5T0U). The DNA-binding motif48 is aligned with the structure. e The CKHS profile and domain annotation of CBP. The ZZ domain is highlighted in red

