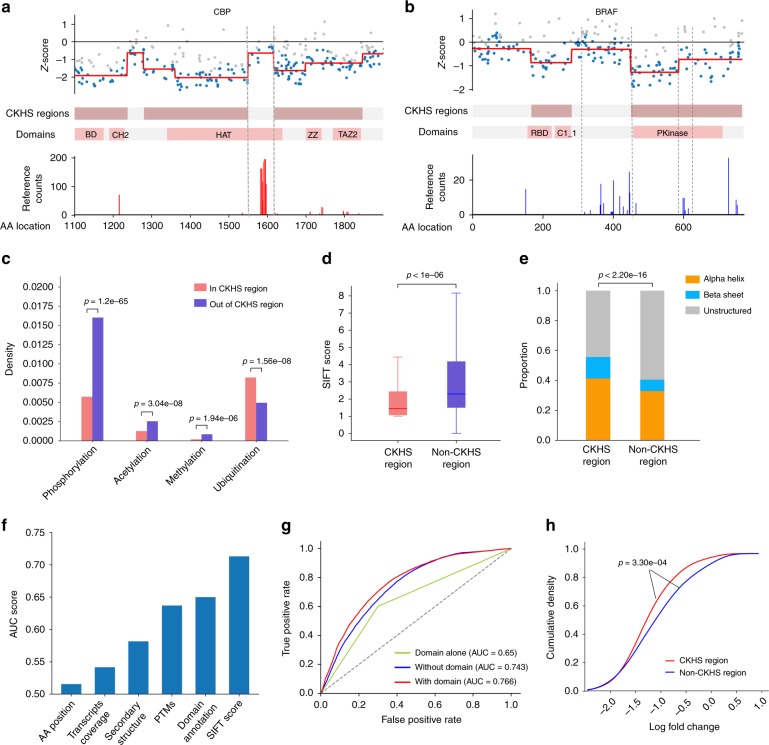
Fig. 4.
CKHS regions are are predictable from protein features. a The zoomed-in views of CKHS profile, domain annotation, and acetylation sites of CBP (AA1100-1900). The Y-axis of the PTM profiles represents the number of publication references collected at https://www.phosphosite.org. b The CKHS profile, domain annotation, and phosphorylation sites of BRAF. c A bar chart showing the density of PTM sites inside or outside of the CKHS regions. The p-values were computed based on hypergeometric distribution. d A box-plot showing the association between CKHS regions and amino acids conservation (SIFT score). The center line, bounds of box and whiskers represent the median, interquartile range and 1.5 times interquartile range, respectively. The p-value was computed using the Mann–Whitney test. e A bar chart showing the distribution of secondary structures for CKHS and non-CKHS regions. The p-value was computed using the Chi-square test. f A bar chart showing the predictive power of bagging SVM, in ROC-AUC score, using individual protein features. The AA position in the protein and the transcript coverage are used as references. g ROC curves showing the predictive powers using all protein features, all features other than domain annotation, and domain annotation alone, respectively. h The sgRNAs targeting core essential genes were categorized based on predicted CKHS regions. The cumulative distributions of sgRNA dropout effects in Avana dataset37 are shown for each category. The p-value was computed using Kolmogrov–Smirnov test

