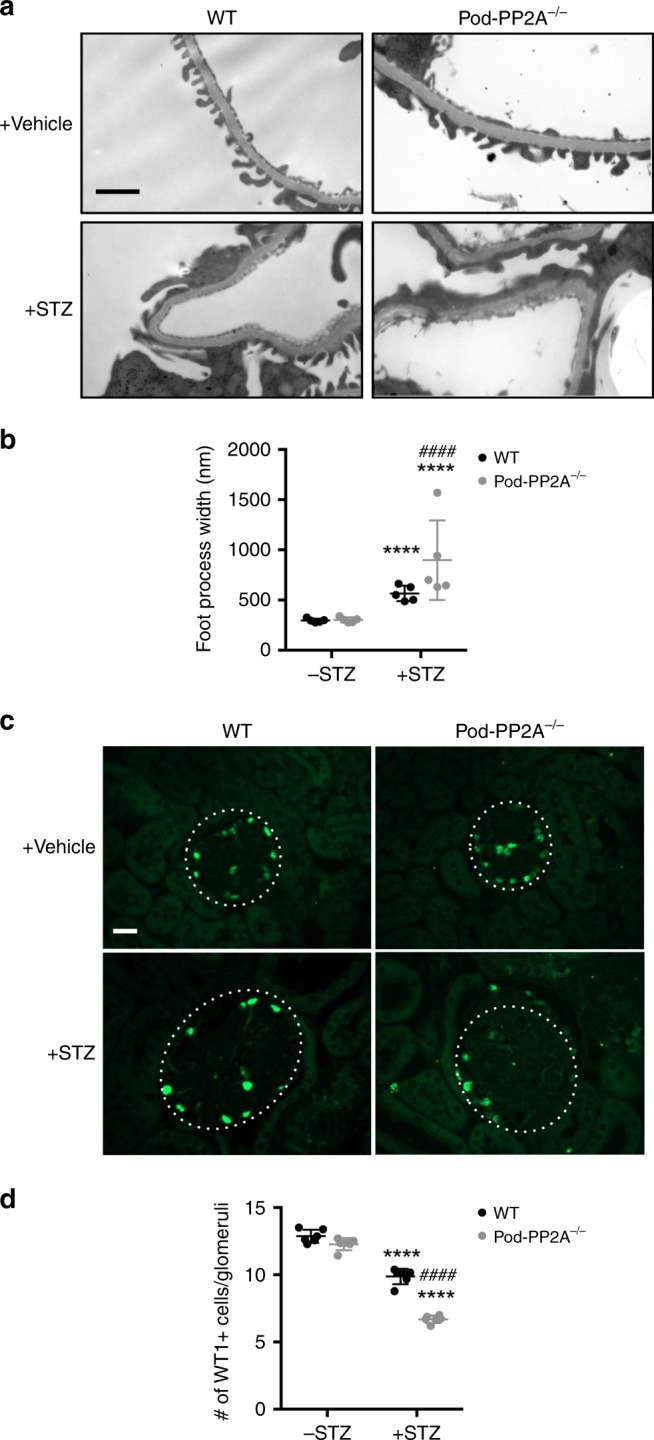
Fig. 7.

Podocyte-specific loss of PP2A increases podocyte injury and loss. a Representative transmission electron microscopy images of kidneys of diabetic and control mice. Scale bar, 1 μm. b Quantification of foot process width. n = 5. c Representative immunofluorescence images of WT1 + podocytes in glomeruli of diabetic and control mice. Glomeruli are outlined with a white dotted circle; scale bar, 20 μm. d Quantification of WT1 + podocytes per glomerular cross-section. n = 5 per group. ****P < 0.0001 vs. respective nondiabetic mice, ####P < 0.0001 vs. WT diabetic mice by two-way ANOVA with Tukey’s post hoc analysis. The data are represented as mean ± SD. Source data are provided as a Source Data file
