Fig. 3.
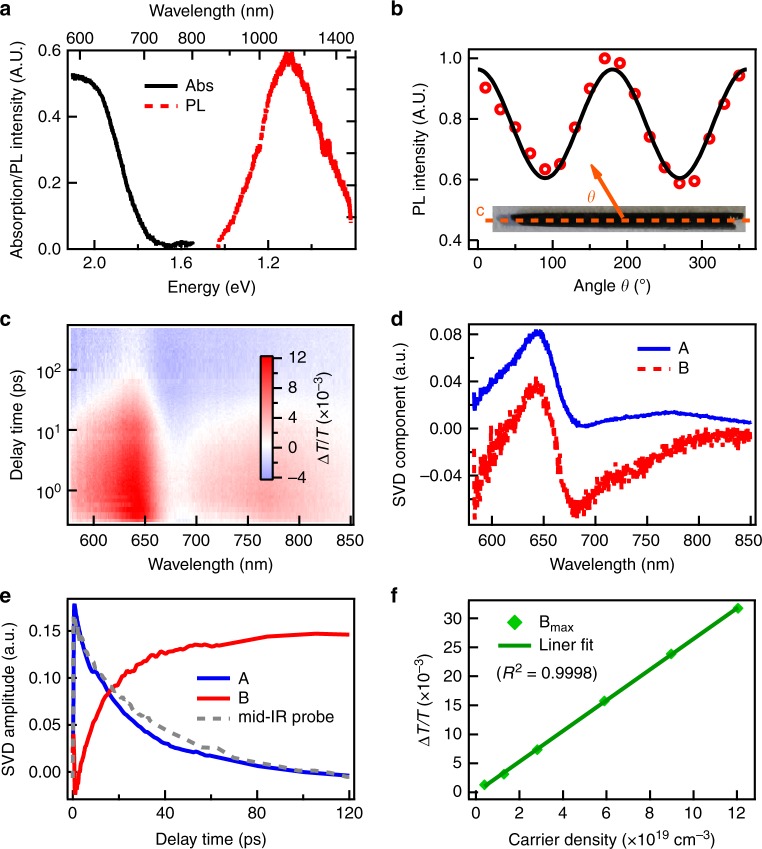
Steady state and TA study of Sb2S3 single crystal. a Absorption and PL spectra of Sb2S3 single crystal. b PL intensity from a Sb2S3 single crystal as a function of polarization detection angle (θ) and fitting with cos2θ. θ is defined to be 0 when detection polarization is along the crystal c-axis direction. Inset: optical image of a needle-like Sb2S3 single crystal. c 2D color plot of TA spectra of Sb2S3 single crystal. d Principle spectral components and (e) associated kinetics from SVD analysis. Also shown in Fig. 3e is the mid-IR (5 μm) probe kinetics (gray-dashed line). f Maximum TA signal of B component as a function of photoexcited carrier density and its linear fitting with R2 equal to 0.9998

