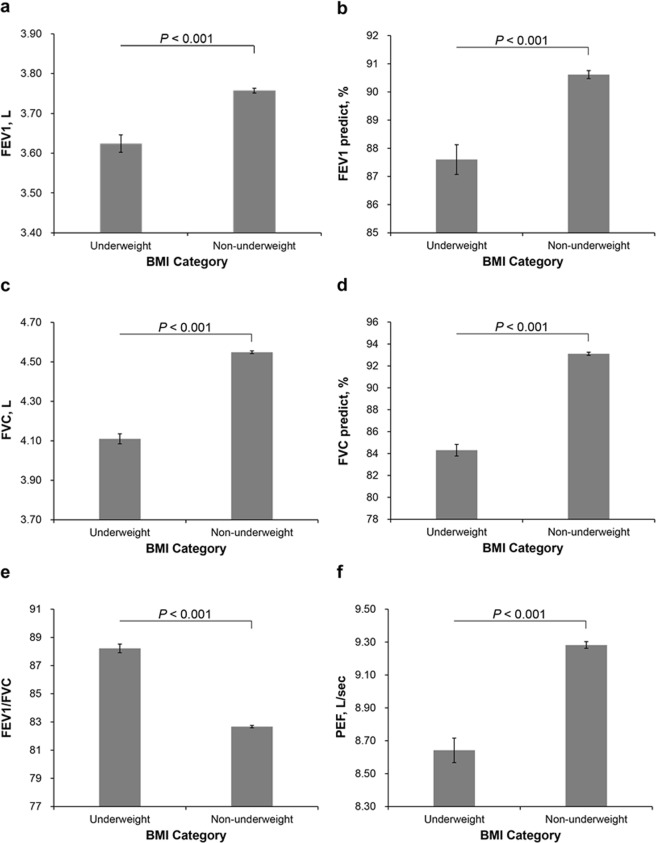
Figure 4.
Adjusted mean values of pulmonary function parameters (95% CI) between underweight and non-underweight in men. (a) FEV1 (L); (b) predicted FEV1 (%); (c) FVC (L); (d) predicted FVC (%); (e) FEV1/FVC; (f) PEF (L/sec). The multivariable model was adjusted for age, height, status of smoking, vigorous exercise (times/week), diabetes, and high-sensitivity C-reactive protein. BMI categories: underweight (<18.5 kg/m2), non-underweight (≥18.5 kg/m2).

