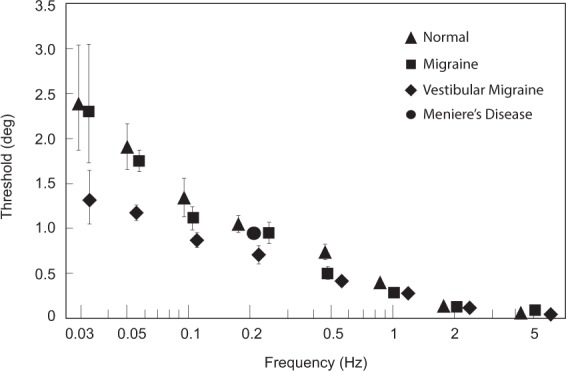
Figure 1.

Roll tilt perceptual thresholds (geometric means+/− one SE) in degrees for the four subject groups, plotted against motion frequency. VM, migraine, and normal subjects were tested at all frequencies and Meniere’s Disease patients were tested at 0.2 Hz. Icons are triangles (normal), squares (migraine), diamond (VM), and circle (Meniere’s disease). For all data points, n = 12 for VM, migraine, and normal groups (except for 0.03 Hz where the n is 4 for these three groups) and n = 8 for Meniere’s patients. Some error bars are smaller than the associated icons and therefore are not visible. Less data is available for 0.03 Hz tilt because most subjects lacked the attention to perform this task adequately (as each trial lasted 33.3 s).
