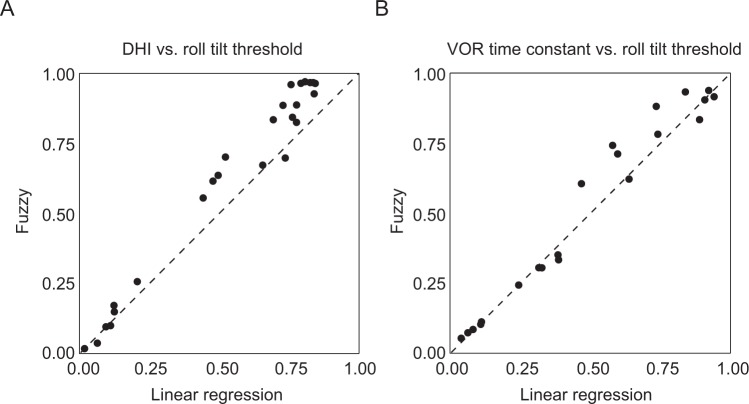
Figure 6.
Comparison of vestibular migraine subgroup categorization methods. (A) Membership probabilities of belonging to the black cluster for all subjects in the DHI vs. roll tilt threshold plot (Fig. 3A). The x axis shows the probabilities calculated using the intuitive, visual approach based on a linear regression separating the data into two groups (dashed black line in Fig. 3A) and the y axis shows the probabilities calculated with the fuzzy clustering method. (B) Membership probabilities of belonging to the black cluster for all subjects in the VOR time constant vs. roll tilt threshold plot (Fig. 3B). Perfect agreement between the classification probabilities produced by the two methods would result in data points falling along the y = x (dashed) line.

