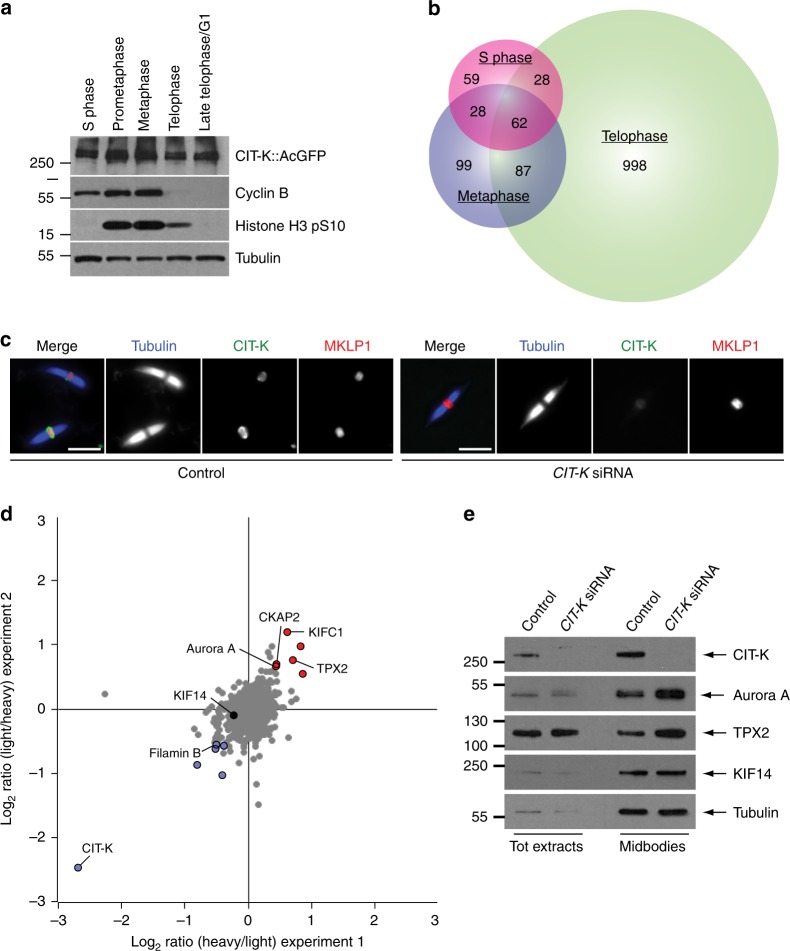
Fig. 1.
CIT-K specifically interacts with a multitude of proteins in cytokinesis. a Western blot analysis of protein extracts from HeLa cells stably expressing a CIT-K::AcGFP transgene synchronized at different stages of the cell cycle. The blots were probed with antibodies against the proteins indicated to the right. Numbers on the left indicate the size, in kDa, of the protein ladder. b Proportional Venn diagram showing the number of proteins identified at each cell cycle stage by AP-MS using CIT-K::AcGFP as bait. c Midbodies purified from HeLa S3 cells treated with siRNAs directed against either a random sequence (control) or CIT-K were fixed and stained to detect tubulin, CIT-K, and MKLP1. Scale bars, 5 µm. d Logarithmic normalized protein ratios from two independent SILAC experiments were plotted against each other. Each point represents a single protein identified. Gray dots correspond to proteins that did not show any significant difference in abundance between control and CIT-K siRNA midbodies. Red and blue dots represent proteins that were either significantly enriched or less abundant after CIT-K depletion in both biological replicates (p value < 0.01; significance B test corrected by Benjamini-Hochberg method). e Western blot analysis of total protein extracts and midbodies purified from telophase HeLa S3 cells treated with siRNAs directed against either a random sequence (control) or CIT-K. The blots were probed with antibodies against the proteins indicated to the right. Numbers on the left indicate the size, in kDa, of the protein ladder. Source data for Fig. 1a and e are provided as a Source Data file

