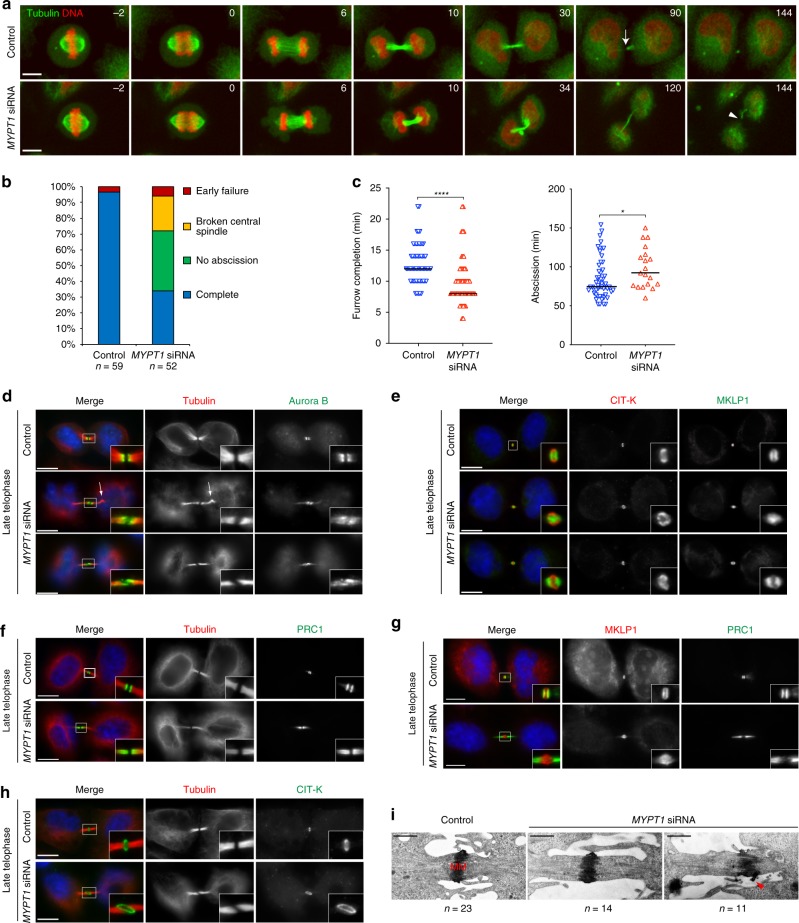
Fig. 6.
MYPT1 is required for central spindle stability and midbody architecture. a Images from time-lapse recordings of HeLa Kyoto cells expressing GFP::tubulin and H2B::mCherry treated with control siRNAs or MYPT1 siRNA for 30 h before filming. Time is in min relative to anaphase onset. The arrow in the 90 min control cell marks the abscission site, while the arrowhead in the 144 min MYPT1 siRNA cell marks the rupture of the central spindle. Scale bar, 10 µm. b Graph showing the frequency of phenotypes observed in the time-lapse recordings described in a. Categories: no abscission indicates cells that either failed abscission or failed to fully separate during filming (Supplementary Movie 7); early failure indicates cells that failed to form a midbody and cleavage furrows collapsed (Supplementary Movie 8); broken central spindles indicates cells in which the central spindle broke before abscission occurred, like in the cell shown in a and in Supplementary Movie 6; n = 59 independent control cells and n = 52 MYPT1 siRNA independent cells were counted. c Scatter plots showing quantification of furrow ingression (from anaphase onset to furrow completion); n = 57 independent control cells and n = 46 MYPT1 siRNA independent cells were counted. Abscission (from furrow completion to abscission) times measured in the time-lapse recordings described in a. n = 57 independent control cells and n = 19 MYPT1 siRNA independent cells that successfully completed abscission were counted. Horizontal bars indicate medians; ****p < 0.0001 (student’s T-test); *p < 0.05 (Mann–Whitney U test). d–h HeLa Kyoto cells (control) or MYPT1 siRNA were stained to detect the indicated epitopes and DNA. DNA condensation and the size of microtubule bundles at the intercellular bridge were used to stage telophase cells. Insets show a 3× magnification of the midbody. The arrow in d marks a bend in the central spindle. Scale bars, 10 µm. i Electron micrographs of midbodies in HeLa cells control or MYPT1 siRNA for 48 h. n = 23 independent control cells and n = 25 MYPT1 siRNA independent cells. The arrowhead marks an abnormal protrusion of the midbody matrix (MM). Scale bars, 1 µm. Source data for Fig. 6b, c are provided as a Source Data file

