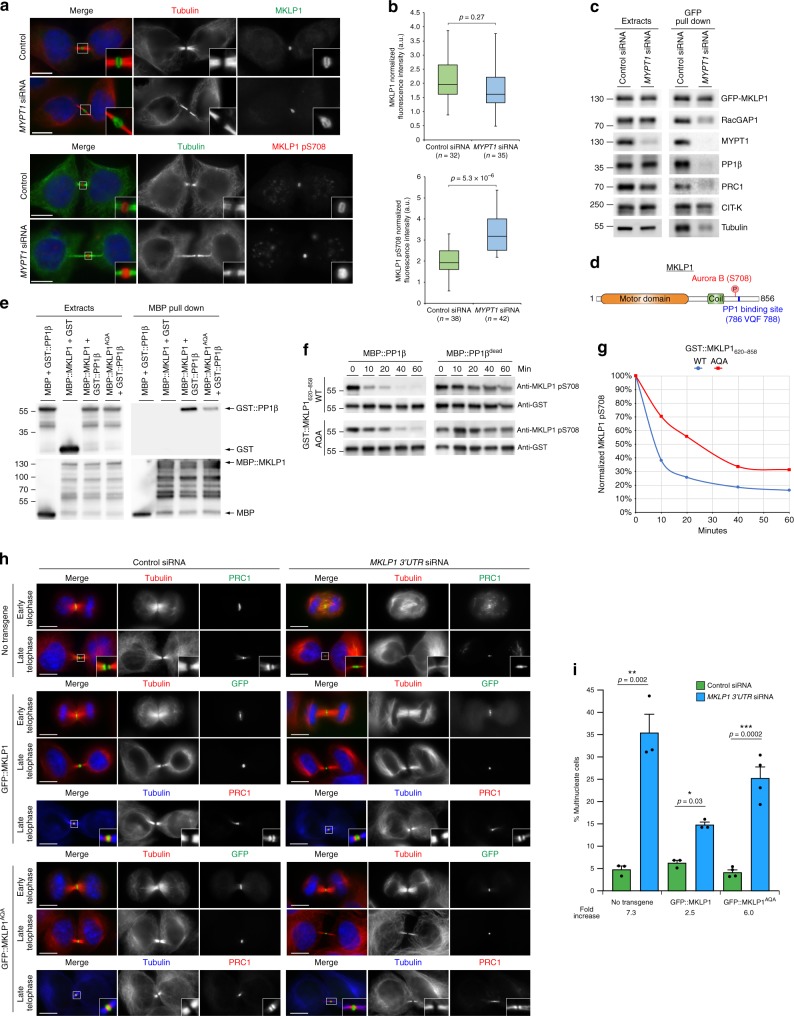
Fig. 7.
PP1β dephosphorylates MKLP1 at S708 in cytokinesis. a HeLa Kyoto cells were treated with control or MYPT1siRNA for 48 h and stained to detect the indicated epitopes. Cells were staged as in Fig. 4. Insets indicate 3× magnification of the midbody. Scale bars, 10 µm. b Quantification of total and pS708 MKLP1 in control and MYPT1siRNA cells. The boxes indicate the first quartile to the third quartile, the horizontal lines the median and the whiskers the minimum or maximum. AU, arbitrary unit; n = 32 independent control cells and n = 35 MYPT1 siRNA independent cells for MKLP1 stained cells; n = 38 independent control cells and n = 42 MYPT1 siRNA independent cells for MKLP1-pS708 stained cells; p values from student’s T-test. c HeLa stably expressing GFP-MKLP1 were treated with control or MYPT1 siRNA, synchronized in telophase and GFP pull-down protein extracts analyzed by western blot. The numbers indicate the sizes of the molecular mass marker. d Schematic diagram of MKLP1 protein. The Aurora B phosphorylation site and the VQF PP1-binding site are indicated. e MBP-tagged MKLP1, MKLP1AQA or MBP alone were co-expressed in yeast and used for MBP pull-down assay. Extracts and pull downs were analyzed by western blot to detect GST and MBP. Numbers indicate the size of the protein ladder. f In vitro phosphatase assay of GST-tagged WT and AQA MKLP1. The reactions were incubated with either MBP-tagged PP1β or a catalytically dead version for the times indicated at the top and analyzed by western blot using antibodies against MKLP1 pS708 and GST. g Graph showing the normalization of MKLP1 pS708 values against the amounts of GST-MKLP1620–858. h HeLa Kyoto cells stably expressing GFP-MKLP1, GFP-MKLP1AQA or no transgene were treated with either control or MKLP1 3′UTR siRNA were stained to detect the indicated epitopes. Scale bars, 10 µm. i Quantification of multinucleate cells from the experiments shown in h. More than 500 independent cells were counted in n ≥ 3 independent experiments. Bars indicate standard errors. *p < 0.05, **p < 0.01, ***p < 0.001 (Mann–Whitney U test). Source data for Fig. 1b-c, e–g and i are provided as a Source Data file

