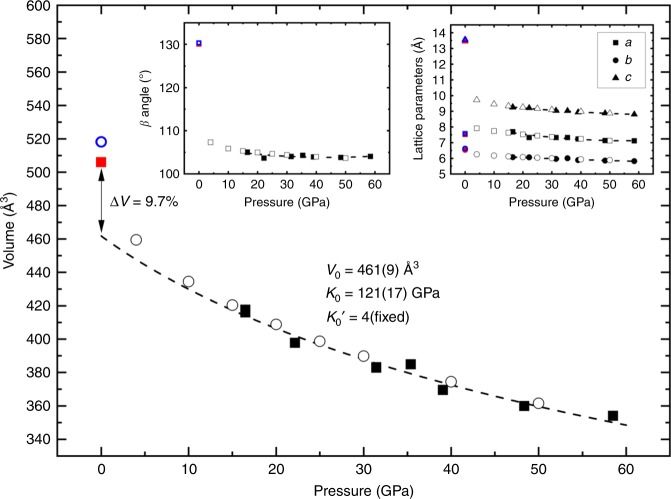
Fig. 3.
Unit cell volume of the Mg2N4 compounds as a function of pressure. All solid and open symbols are experimental and theoretical data points, respectively, while the dashed line is the fit of the experimental PV data of the β-Mg2N4 compound using the second order Birch-Murnaghan equation of state (BM2 EoS) (V0 = 461(9) Å3 and K0 = 121(17) GPa). Red and blue symbols are the experimental and theoretical, respectively, unit cell volume of α-Mg2N4 at ambient pressure. The extrapolation of the experimental equation of state suggests a volume jump of 9.7% between the high pressure β-Mg2N4 and the ambient pressure α-Mg2N4 phases. The fit of the theoretical PV data using the BM2 EoS gives for β-Mg2N4 V0 = 470.23 Å3 and K0 = 110.83 GPa. The theoretical volume difference is thus of 10.2% between the calculated β-Mg2N4 and α-Mg2N4. The insets show the dependence of the unit cell parameters on pressure. The full (open) black and full red (open blue) symbols represent experimental (theoretical) data from the β and α phases of Mg2N4. The slightly higher volume obtained from the DFT calculations, compared to the experimental values, shows the underbinding in GGA26

