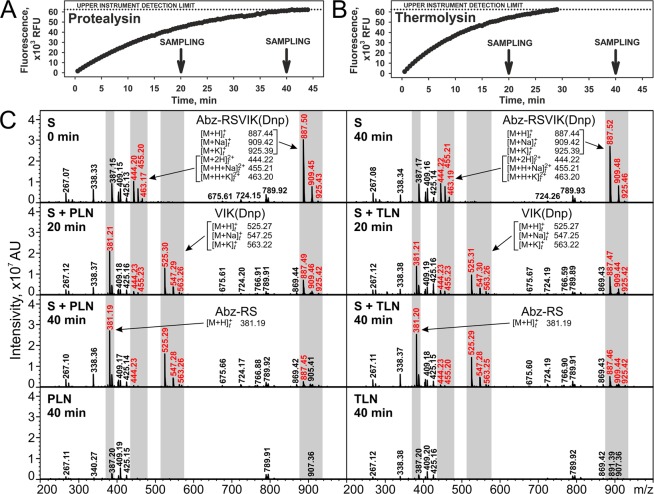
Figure 2.
Analysis of Abz-RSVIK(Dnp) cleavage by protealysin (PLN) and thermolysin (TLN). (A,B) Kinetics of Abz-RSVIK(Dnp) hydrolysis by PLN and TLN, respectively. The arrows indicate time points of mass spectrometry. RFU, relative fluorescence units. (C) Mass-spectrometric analysis of reaction mixes. The peaks corresponding to the substrate and hydrolysis products are indicated by red font and gray vertical bars. S, substrate; AU, arbitrary units; m/z, mass-to-charge ratio; [M + nH/K/Na(+Na/K)]Z+t, theoretical m/z values.

