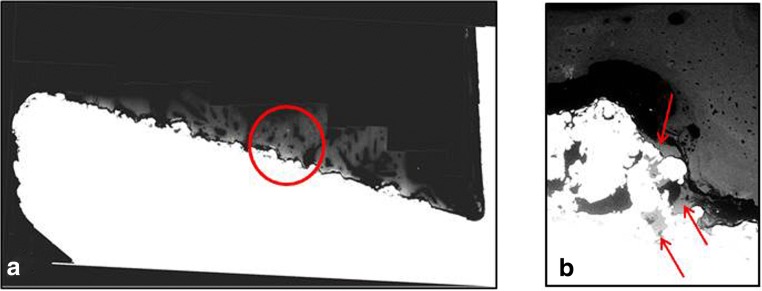
Fig. 4.
Cross-sectional backscatter electron microscopy images of bone-implant interface. A representative slice (a) shows the implant in white and the bone in light gray. An example of bone ongrowth is shown by the red circle. Bone ingrowth assessed at × 111 magnification is highlighted by the red arrows (b).

