Fig. 6.
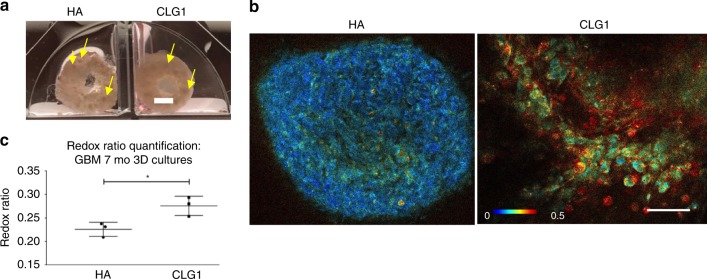
Live metabolic imaging of glioblastoma cultured in 3D silk-CLG1 or silk-HA constructs. a Macroscopic views of the GBM spheres within silk-CLG1 or silk-HA constructs. Scale bar, 2 mm. The yellow arrows point at spontaneously forming sphere-like structures from the seeded tumor cells post dissociation. b Representative redox ratio images from endogenous metabolic co-factors FAD and NADH within GBM cells in 3D constructs at 1.5 mo post-gel addition and 7 mo post cell seeding. Scale bar, 50 µm. Image heatmap reflects varying redox ratio intensities. c Quantitative intracellular signal evaluation validated the existence of metabolic differences between HA and CLG1 conditions, with a statistically significantly higher redox ratio (FAD/FAD + NADH) in CLG1 cultures. Unpaired two-tailed t-test, p = 0.0271, df = 4, t = 3.406, n = 3 per condition (Multiple areas imaged per condition = 3–8; total imaged in CLG1 = 13, HA = 19). Error bars indicate mean ± s.d, Source data are provided as a Source Data file

