Fig. 7.
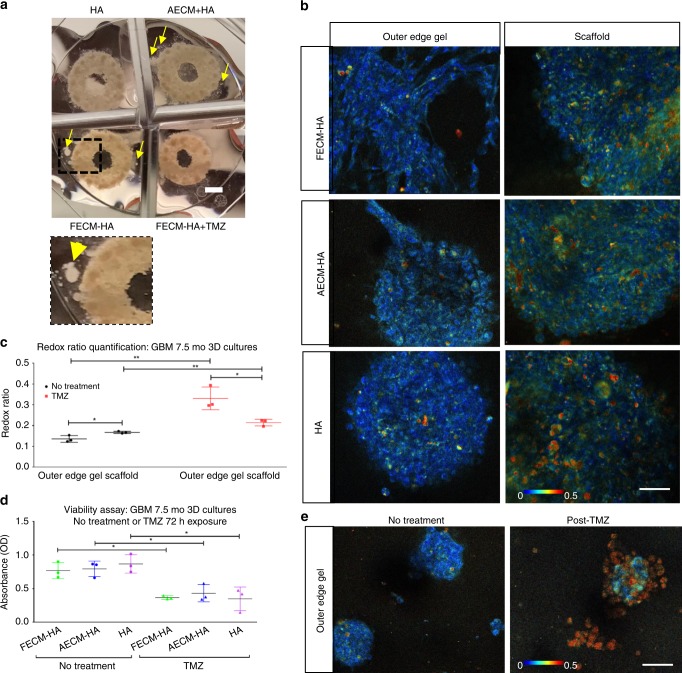
Live metabolic imaging of glioblastoma cultured in 3D silk-HA-ECM constructs. a Macroscopic views of the GBM spheres within silk-HA-ECM constructs, post- DMSO (no treatment control) or temozolomide (TMZ) exposure. Scale bar, 2 mm. b Representative redox ratio images from endogenous metabolic co-factors FAD and NADH within GBM cells in 3D silk-HA constructs at 2 mo post-gel addition and 7.5 mo post cell seeding, with right panel showing images taken within the scaffold portion and left panel with images taken in the outer edge gel of the construct, respectively. Scale bar, 50 µm. Image heatmap is the same for panel images and reflects varying redox ratio intensities. c Redox ratio quantification corresponding to outer edge gel areas and within scaffold areas, post-DMSO or TMZ exposure. Unpaired two-tailed t-tests between separate pairs; n = 3 per condition (multiple areas imaged per condition),**p < 0.0081, *p < 0.0321, df = 4, t > 3.228. d Wst-1 bulk viability assay at 7.5 mo in 3D GBM silk-HA cultures post- DMSO and TMZ exposure. Unpaired two-tailed t-test between separate pairs, *p < 0.0221, df = 4, t > 3.635. e Representative redox ratio images within GBM cells in 3D silk-HA constructs at 2 mo post-gel addition and 7.5 mo post cell seeding. 2-photon signals were obtained post- 72 h exposure to either DMSO or TMZ. Scale bar, 50 µm. Error bars indicate mean ± s.d, Source data are provided as a Source Data file

