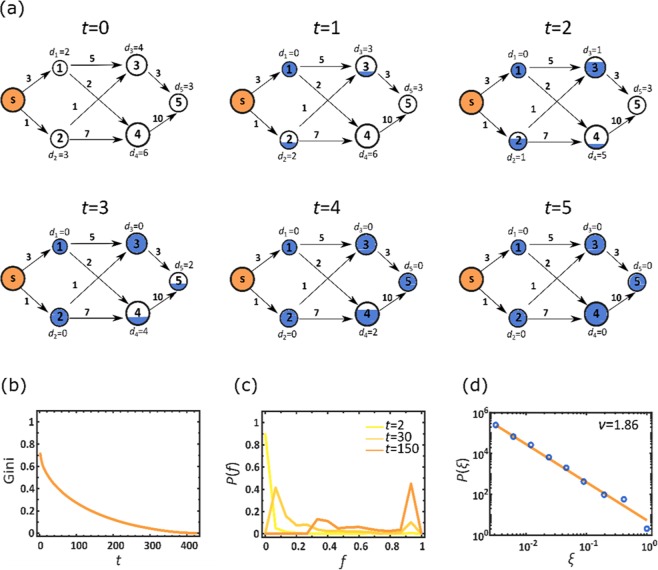
Figure 5.
Optimizing centralized mitigation. (a) To enhance the efficiency of the centralized drug distribution we used the commodity flow framework: each node is assigned an initial demand dn(0), proportional to its population (node size); and each air-route is assigned a daily carrying capacity Cnm (numbers by edges), proportional to its daily volume of passenger traffic. In each time step t we optimize the flow from the source s to supply as much of the therapeutic as possible, within the constrained Cnm. As nodes accumulate the therapeutic (blue fill) their demand is updated accordingly. For example, node 2’s initial demand is d2(0) = 3. Following the first round of shipment (t = 1) a single unit is shipped from s, supplying a fraction of d2(0), and hence reducing its demand to d2(1) = 2. A node is fully supplied (fully blue) at time , when and accordingly . For node 2 we have . (b) The Gini coefficient vs. t, as obtained from the time dependent fractional stock levels fn(t). We find that despite the optimization, inequality continues to govern the therapeutic distribution, as expressed by the high Gini coefficient at small t. This describes a scenario in which few nodes are fully stocked early on, while the majority of nodes will only reach (and hence Gini → 0) at much later times. (c) The probability density P(f) vs. f at three selected time points t. Similarly to Fig. 3b we observe a highly unequal distribution in which selected nodes are fully supplied (right peaks), while others are still deprived (left peaks). These patterns in (b) and (c) are strikingly reminiscent of the those observed earlier in Fig. 3a,b. (d) P(ξ) vs. ξ, capturing the probability density that a randomly selected node enjoys a supply rate of . Here we approximate rates as , namely the average supply rate in n under therapeutic distribution from s. The power-law form of P(ξ) (solid line represents ) demonstrates the uneven dissemination of the therapeutic, in which supply rates range over orders of magnitude. This pattern of P(ξ) is, again, analogous with the identical patterns of distribution inequality observed in Fig. 4d,g,k, further reinforcing the intrinsic heterogeneity characterizing network-based centralized mitigation.

