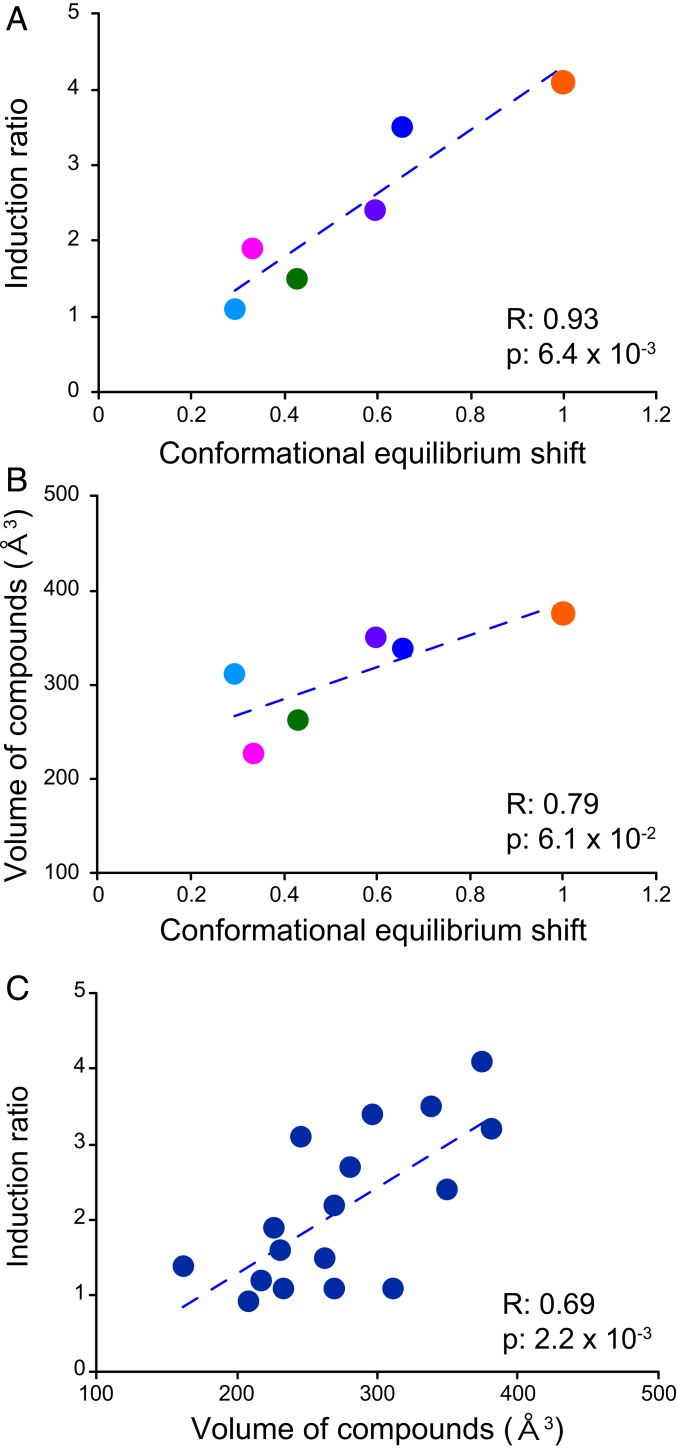
Fig. 4.
Identification and characterization of the functional conformational equilibrium that defines QacR transcriptional regulation. (A) Correlation between the compound induction ratio and the conformational equilibrium shift, deduced from the slope of the 13C CSPs shown in Fig. 3. (B) Correlation between the compound volume and the conformational equilibrium shift. (C) Correlation between the compound volume and the compound induction ratio. The compound induction ratios were obtained from Grkovic et al. (12). The compound volumes were calculated using the Chem Sketch software (Advanced Chemistry Development). Each dot represents one compound and the compounds used in this study are color coded: Rho6G, orange; DiOC3, dark blue; XViol, purple; DAPI, pink; Et, green; MalacG, light blue. The broken lines in the figure panels are the approximation straight lines for the data.

