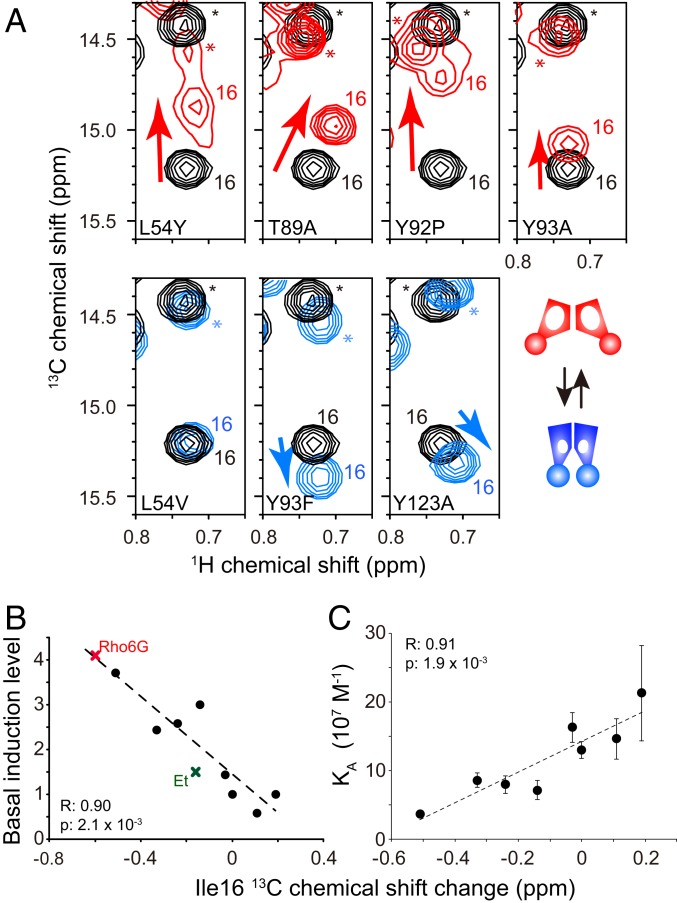
Fig. 7.
NMR analysis of constitutively active QacR mutants. (A) Ile-16 δ1 resonances of QacR WT (black) were overlaid with that with those of the constitutively active mutants (red) and the less affected mutants (cyan). Asterisks highlight signals originating from Ile-172. (B) Correlation between the Ile-16 13C chemical shift changes of the mutants relative to WT QacR and basal induction levels. Those for the Rho6G- and Et-bound states are also indicated. (C) Correlation between the 13C chemical shift changes of mutants relative to the WT QacR and the binding affinity to the IR1 DNA. Basal transcription levels of QacR mutants reported in Peters et al. (20) were used.

