Fig. 3.
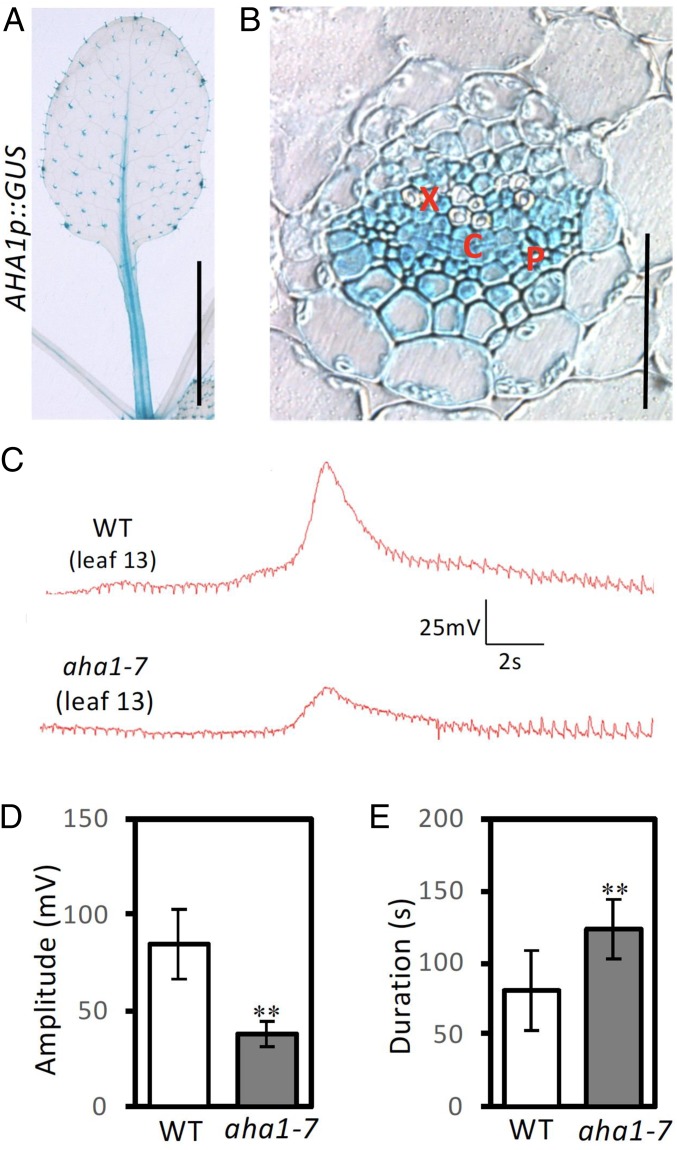
AHA1 promoter activity associated with the vasculature, and electrical penetration recordings from sieve elements. (A) GUS staining pattern for an AHA1p::GUS transcriptional reporter; Leaf 6 of 4 wk-old plant. (Scale bars, 0.5 cm.) (B) Transversal petiole cross section from leaf 6. (Scale bar, 50 μm.) (C–E) Potential changes recorded on leaf 13 after wounding leaf 8. (C) Traces from WT and aha1-7. Only the region of fast spike signal is shown, see SI Appendix, Fig. S6 for details of the overall signal structure and quantification. (D) SWP amplitude and (E) duration, see EPG recording methods. X, xylem region. P, phloem region, and C, cambium region. Data shown are means ± SD. Asterisks indicate significant difference with WT. Student t test: **P < 0.01, n = 10.

