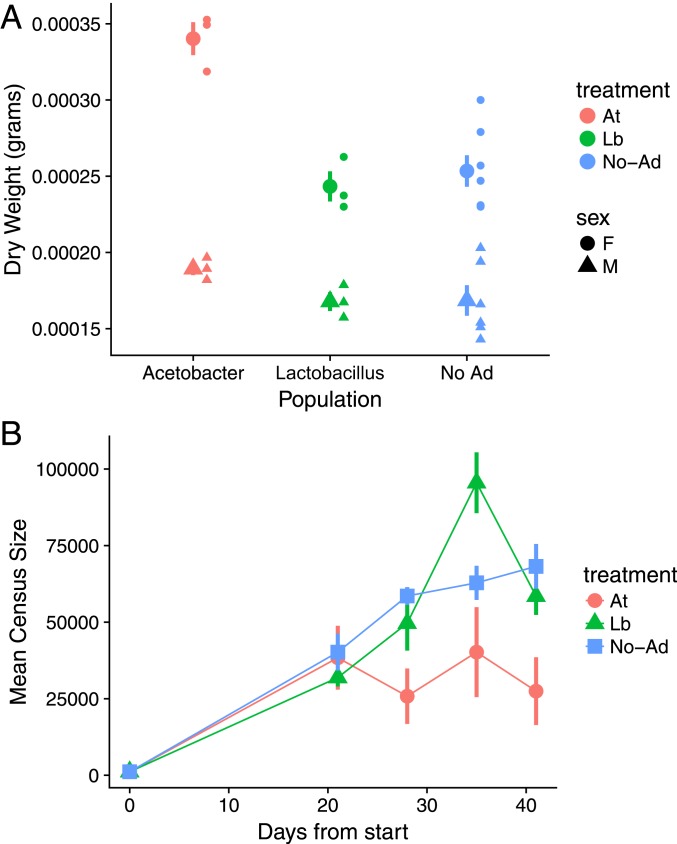
Fig. 2.
Population size and body mass of D. melanogaster populations from each microbial addition treatment. (A) The mean from each treatment at the end of experiment of the dry weight of D. melanogaster individuals of each sex from each replicate cage. (B) Host population size over the course of the experiment. In both graphs, values plotted are means ± SEM.

