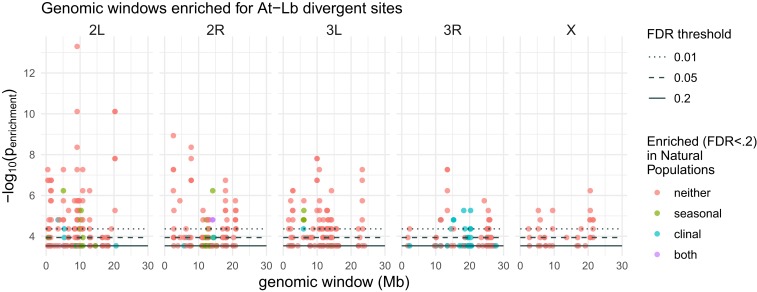
Fig. 3.
Genomic landscape of divergence between At and Lb populations. Local enrichment of divergent SNPs (divergence GLM P < 0.05 and effect size ≥ 2%) was calculated using a hypergeometric test in windows of 250 SNPs, tiled across the genome with 50 SNP shifts. Shown at the bottom is the −log10 of the enrichment P value for windows with FDR ≤ 0.2. Graphs are chromosomes, and the black dotted lines show the corresponding score thresholds for FDR < 0.01 and <0.05, in addition to the solid line for FDR < 0.2. Windows are colored according to whether they also show enrichment (FDR < 0.2) for sites that vary clinally and/or seasonally in natural populations.

