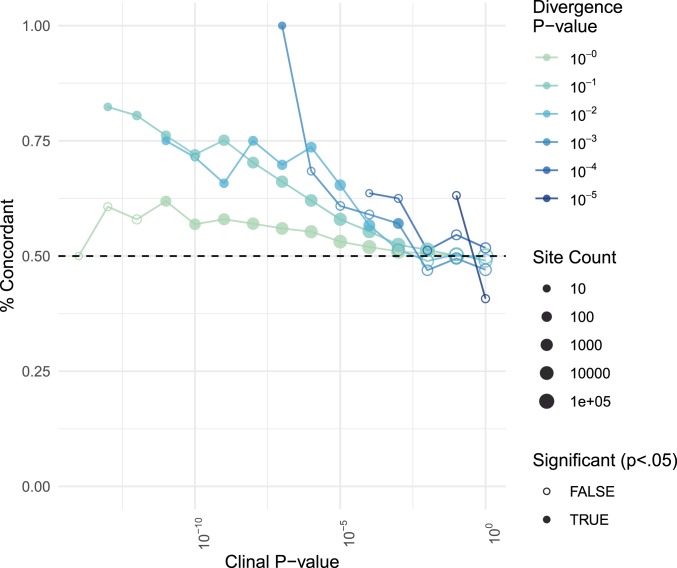
Fig. 4.
Concordance of allelic divergence in natural and experimental populations. Concordance is calculated as the percent of sites in which the allele found at higher frequencies in natural high-latitude populations compared to low-latitude populations was also found at higher frequencies in experimental Lb populations compared to At populations. Each point refers to a distinct subset of sites, binned according to clinality (x axis) and At-Lb divergence (color); the number of sites examined is indicated by the size of the point. A dashed black line is drawn at the null expectation of 50% concordance. Solid-colored points represent site subsets in which concordance is significantly elevated compared to the shuffled null distribution.

