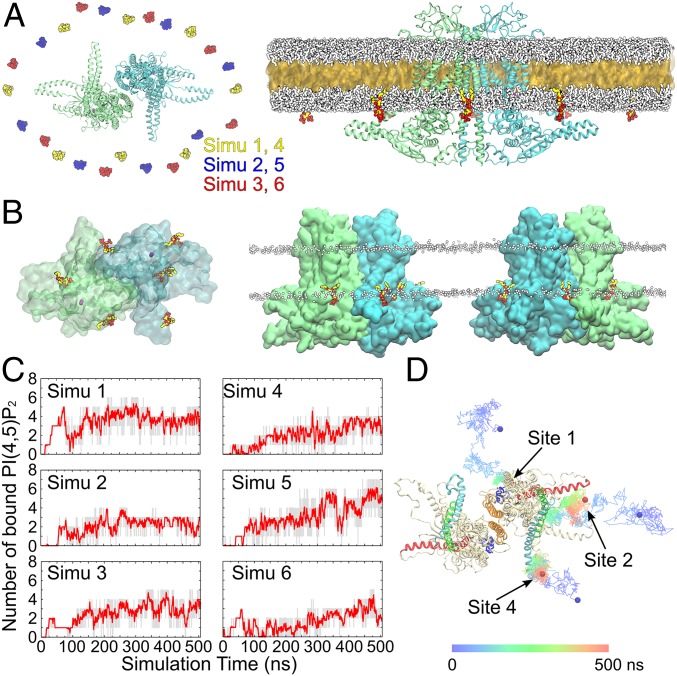
Fig. 5.
Spontaneous PI(4,5)P2 binding captured in MD simulations. (A, Left) Top view showing the initial placement of 8 C6-PI(4,5)P2 molecules in the inner leaflet of the bilayer surrounding the channel. Six independent simulations were performed with the C6-PI(4,5)P2 molecules placed in different initial positions, as shown by different colors. The 2 subunits of ANO1 are shown in green and blue. (A, Right) The initial HMMM simulation system viewed from the membrane. A large fraction of the acyl tails of the membrane-forming lipids is replaced by a liquid organic phase (yellow surface representation). The C6-PC molecules are shown in white. The C6-PI(4,5)P2 molecules are colored (oxygen, red; phosphorus, tan; carbon, yellow). Ions and water molecules are not shown for clarity. (B) Top and side views showing the positions of the C6-PI(4,5)P2 molecules at the end of one representative HMMM simulation (simu 5). Six C6-PI(4,5)P2 molecules were directly coordinated by the charged/polar residues of the channel. Ca2+ ions are shown as purple spheres. The membrane position is demarcated by the phosphorus atoms (white spheres) of the C6-PC lipids. (C) Number of bound C6-PI(4,5)P2 molecules (gray trace) and the moving average (red; bin = 20) plotted vs. simulation time for the 6 simulations. (D) Representative trajectories showing the binding of C6-PI(4,5)P2 to sites 1, 2, and 4. The colored lines illustrate the position of the 4′-phosphate of the C6-PI(4,5)P2 over the 500-ns simulations at 100-ps intervals. The initial and final positions of the 4′-phosphate are shown as blue and red spheres, respectively.

