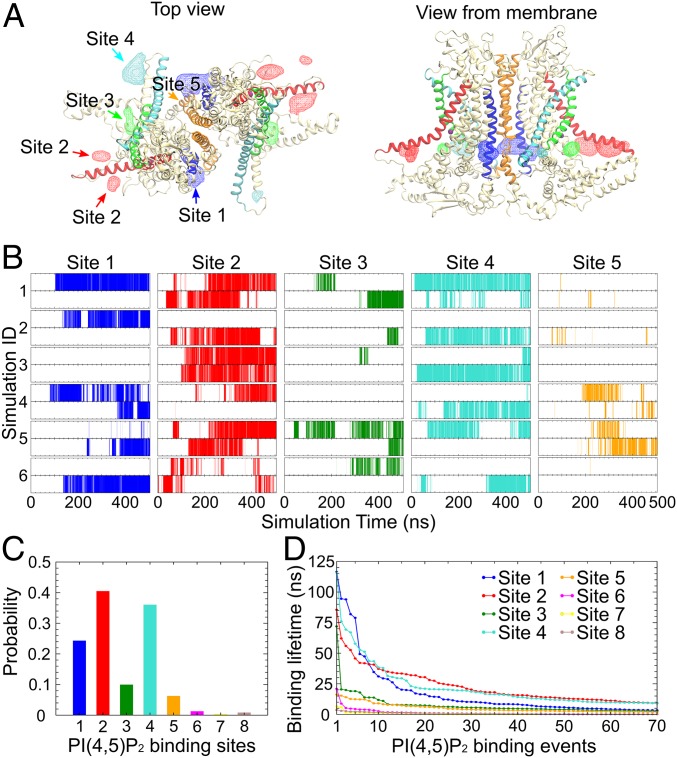
Fig. 6.
PI(4,5)P2 binding at specific sites on ANO1. (A) Volumetric map of inositol occupancy extracted from the last 200 ns of the HMMM simulations is shown as colored wireframe contoured at isovalue 0.05 overlaid on the protein structure. Analysis combines results from the 6 simulations. Each local map is colored with the same color used for the nearby transmembrane helix that is involved in C6-PI(4,5)P2 binding (TM2, blue; TM3, cyan; TM4, green; TM6, red; and TM10, orange). (B) C6-PI(4,5)P2 occupancy at sites 1 to 5 in each subunit (Upper: subunit 1; Lower: subunit 2) during the 6 independent C6-PI(4,5)P2-binding simulations. C6-PI(4,5)P2 binding is indicated by the vertical lines at the corresponding time point. (C) The probability of C6-PI(4,5)P2 occupancy for each site over the 6 C6-PI(4,5)P2-binding simulations. C6-PI(4,5)P2 binding was observed mainly in sites 1, 2, and 4. (D) Dwell time of the top 70 binding events in each of the 8 binding sites, sorted in descending order. Only sites 1, 2, and 4 exhibit significant dwell times.

