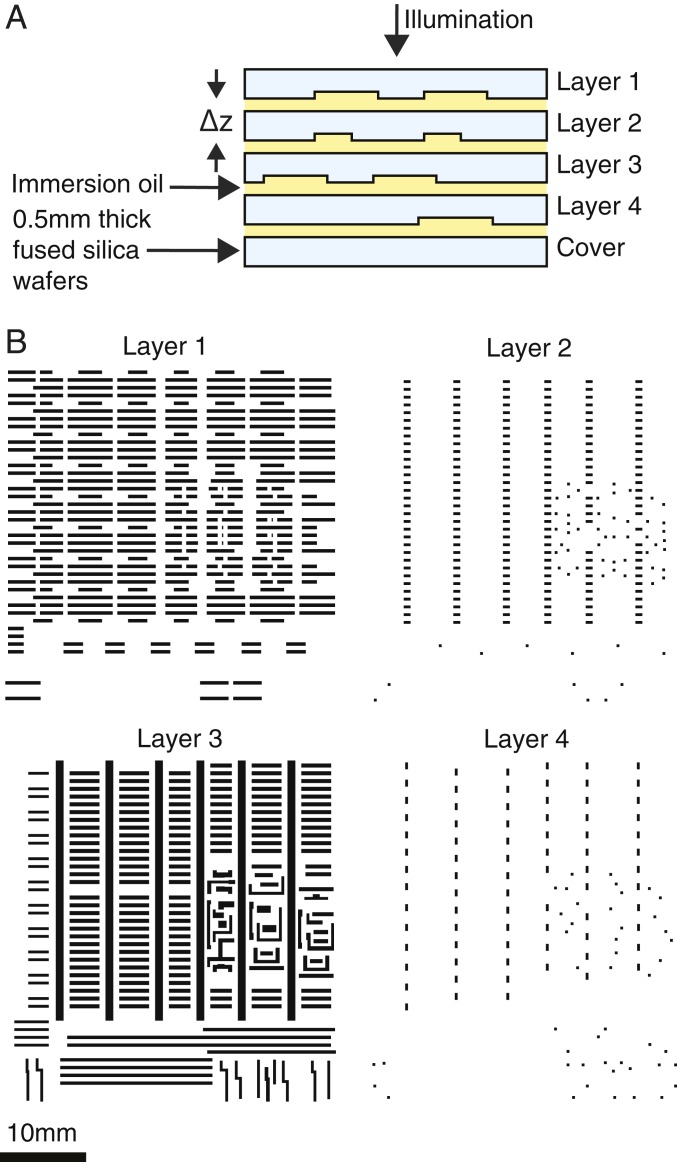
Fig. 1.
(A) Sample cross-section. The depth of the etched patterns was measured (Materials and Methods) and the refractive index of the oil was controlled to achieve a known phase shift of −0.32 rad. mm. (B) IC patterns used for each of the 4 layers. The white background represents the original wafer thickness and the black areas indicate where the wafer has been etched.

