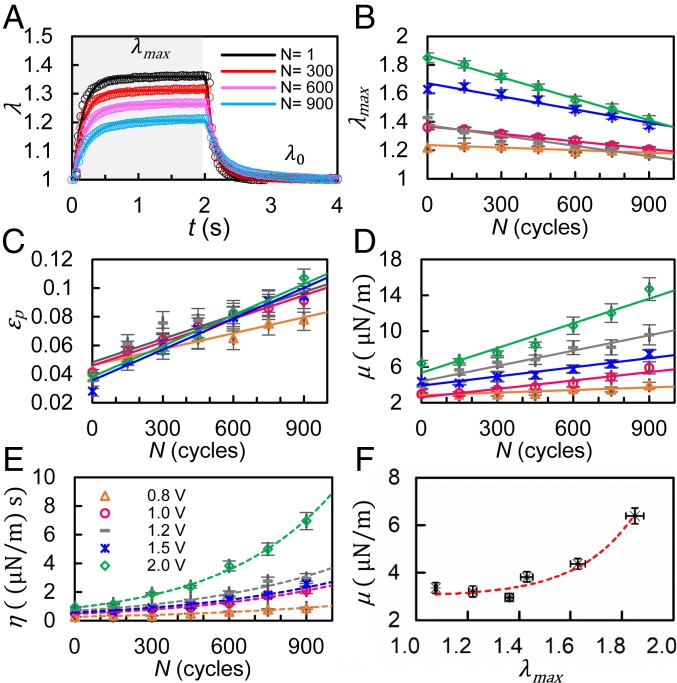
Fig. 2.
Degradation of mechanical properties of RBCs under cyclic tensile loading of constant amplitude. (A) Instantaneous values of λ averaged from individually tracked cells (n = 20) in both stretching phase (gray region) and relaxation phase (white region) for N = 1, 300, 600, and 900 fatigue cycles at 1.0 V. Open circles represent experimental measurement and the solid curves represent exponential fit to the data. (B–E) Variation of the mean value of λmax, εp, μ, and η, respectively, of RBCs with the number of fatigue loading cycles, N, for 5 different voltage levels of 0.8, 1.0, 1.2, 1.5, and 2.0 V (represented by the same set of symbols as shown in E). (F) Nonlinearity in membrane shear modulus, μ, plotted as a function of λmax at N = 1. The solid lines represent the best fit linear regression lines. The dashed lines represent the best fit exponential curves. Error bars indicate standard error of the mean (SEM).

