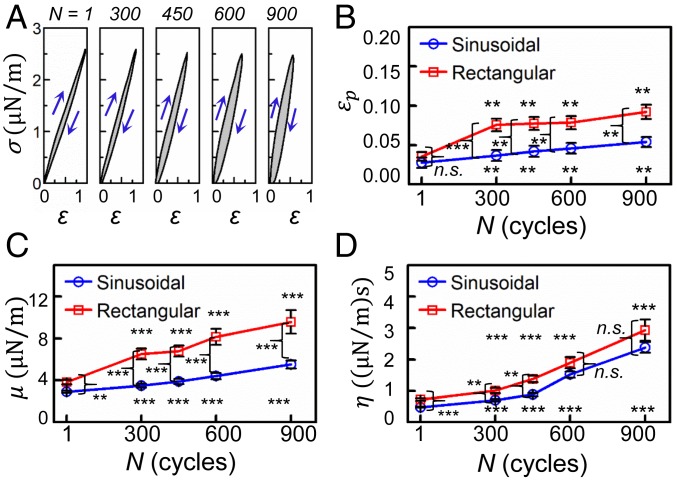
Fig. 5.
Effect of loading waveform on mechanical degradation of RBCs during constant-amplitude mechanical fatigue. (A) Stress–strain curves showing the hysteresis loops (shaded region enclosed by the loading and unloading curves) for the indicated number of fatigue cycles for the HWR sinusoidal waveform. Blue arrows indicate loading and unloading in each case. (B–D) Variation of of εp, μ, and η as a function of the number of fatigue cycles, and comparisons of mechanical characteristics between the HWR sinusoidal loading and the rectangular step-function waveforms for the indicated fatigue cycles. Error bars indicate SEM. **P < 0.01, ***P < 0.001; n.s., nonsignificant.

