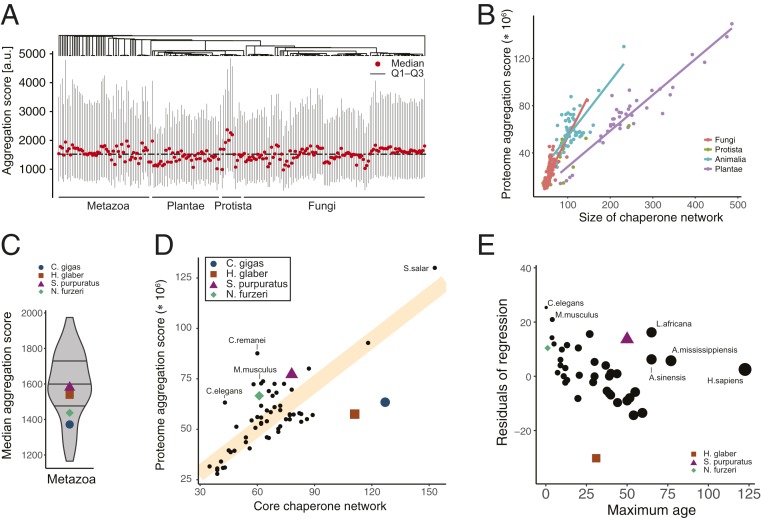
Fig. 4.
Balanced protein homeostasis and organismal robustness. (A) Distribution of predicted protein aggregation propensities in proteomes across the previously computed phylogeny. Shown are median, 25% (Q1), and 75% (Q3) percentiles of the distributions of per-protein predicted aggregation scores for each species. (B) Link between proteome aggregation score, which was computed as size of a proteome weighted by its predicted propensity to aggregate, and size of chaperone networks. Regression lines highlight distinct trends for individual species kingdoms. Similarly strong trends can be observed between the proteome and chaperone network sizes, respectively (SI Appendix, Fig. S4 and Table S4). (C) Distribution of median aggregation scores across the animal kingdom. (D) Relationship between the sizes of the core chaperone networks composed of Hsp40, Hsp70, and Hsp90 chaperones and the proteome aggregation score. The regression fit (orange line) separates organisms that are predicted to be more fragile (above line) vs. more robust (below line). (E) Diversion from balanced protein homeostasis correlates with longevity. The residuals of the regression fit (D) serve as a proxy for organism fragility or robustness and are plotted against data on species maximum age.

