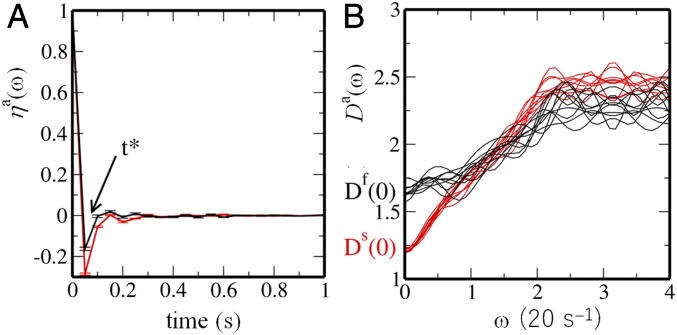
Fig. 3.
Autocorrelation functions of displacement of single nucleosomes and the density of vibrational modes. (A) The autocorrelation function of single-nucleosome displacement, , is plotted as a function of . Bars show the standard errors among 10 cells. (B) The density of vibrational modes, , is plotted as a function of frequency for 10 cells. In A and B, curves are plotted for fast (; black) and slow (; red) nucleosomes.

