Fig. 2.
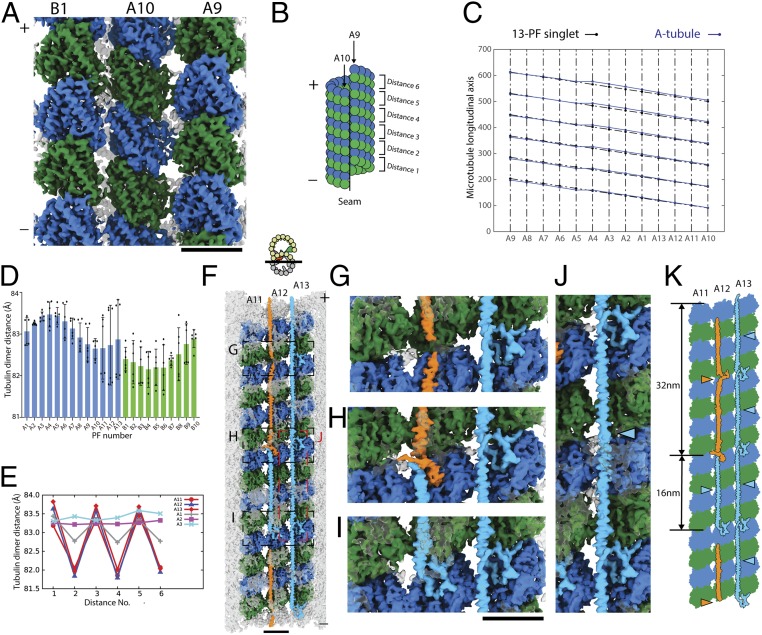
The complex tubulin lattice within the 48-nm repeating unit of the doublet. (A) Outside view of surface rendering of the doublet at PFs A9, A10, and B1. α- and β-tubulins are colored green and blue. (B) Schematic diagram of the A-tubule and the tubulin dimer distance measurement. (C) Two-dimensional plot of the tubulin lattice of the A-tubule of the doublet (blue) and the 13-PF singlet (black) (29). The tubulin lattice is cut and unfurled at the seam as in B. Despite having the same 13-3 B-lattice as the 13-PF singlet, the A-tubule of the doublet shows a nonuniform tubulin dimer distance and Z-shift. (D) Plot of the dimer distance measurements among PFs in the doublet. For each PF, 6 dimer distances within the 48-nm repeating unit (illustrated in B) were measured and plotted as dots. Mean value (bar) with SD (error bar) for each PF are shown. (E) Bimodal pattern of the tubulin dimer distances. The dimer distances from PFs A11–A13 and A1–A3 of the doublet were plotted in the same longitudinal order as in the 48-nm unit. The dimer distances of PF A11 to A1 oscillate with every 2 tubulin units (∼16 nm). (F) Luminal view of the PF ribbon region A11–A13. fMIP densities in the A11–A13 region are now colored based on its tracing and morphology. The short 16-nm filament density is colored in light blue while the longer filament density is colored in orange. Tubulins in PFs A11–A13 are colored while all other densities are transparent. Magnified views of G–J are indicated by a dashed box in F. (K) Schematic diagram of the filament density identified in the PF ribbon region. Per 48 nm, there are 3 short filaments between PFs A12 and A13 (light blue arrowheads) and there is 1 short filament (light blue arrowheads) and 1 longer filament (orange arrowhead) between PFs A11 and A12.

