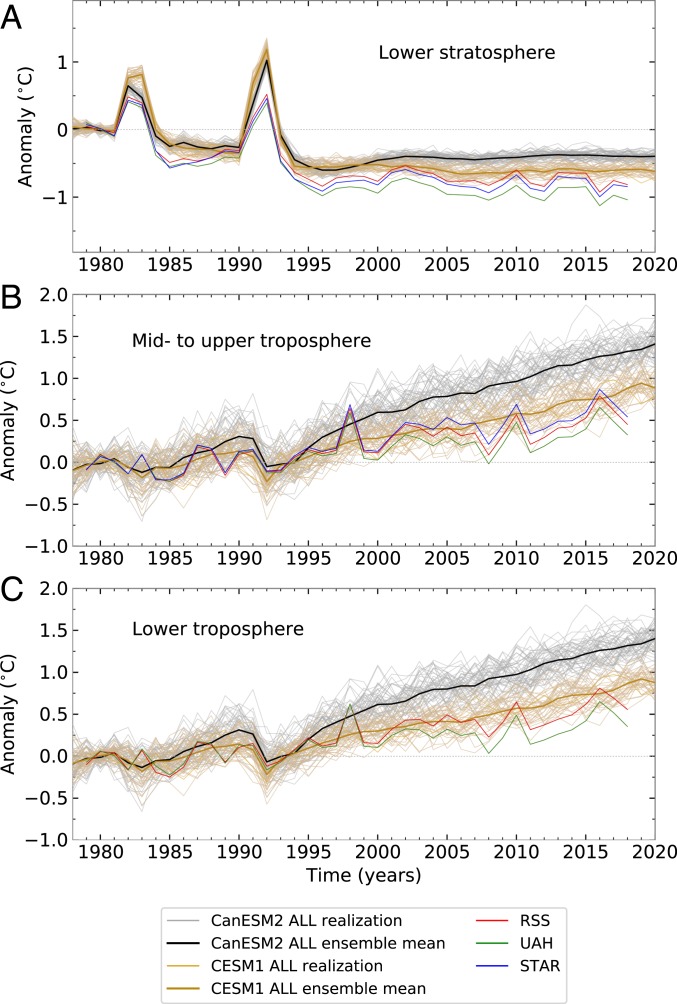
Fig. 1.
Time series of anomalies in annual-mean atmospheric temperature in the 50- and 40-member CanESM2 and CESM1 ALL ensembles (respectively) and in RSS, STAR, and UAH satellite data. (A–C) Results are for TLS (A), TMT (B), and TLT (C). Temperatures are spatially averaged over areas of common coverage in the simulations and satellite data (82.5°N to 82.5°S for TLS and TMT and 82.5°N to 70°S for TLT). The reference period is 1979 to 1981. STAR does not provide TLT data.

