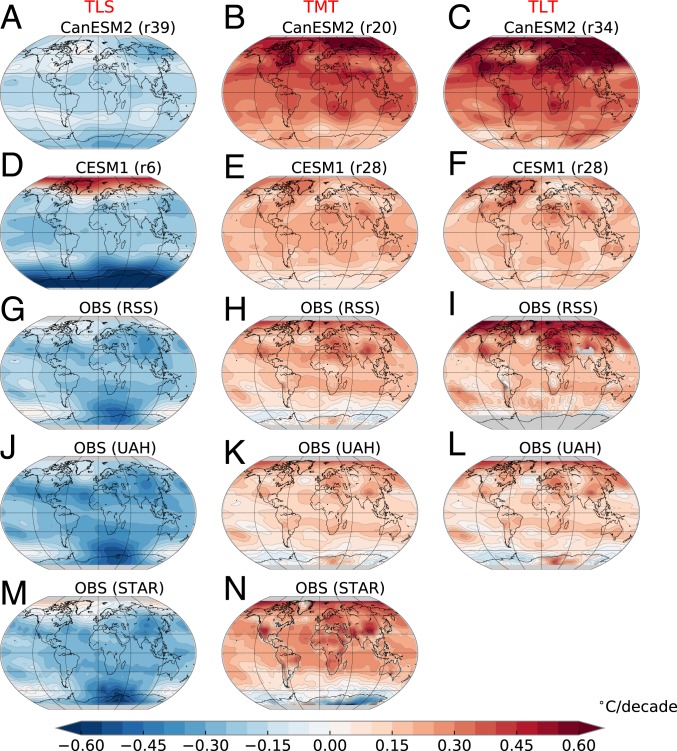
Fig. 2.
(A–N) Least-squares linear trends over 1979 to 2018 in annual-mean TLS (A, D, G, J, and M), TMT (B, E, H, K, and N), and TLT (C, F, I, and L). Results are from 1 individual CanESM2 and CESM1 ALL realization (A–F) and from 3 different satellite datasets (RSS, UAH, and STAR) (G–N). Model results display the ensemble member with the smallest global-mean lower stratospheric cooling trend or tropospheric warming trend.

