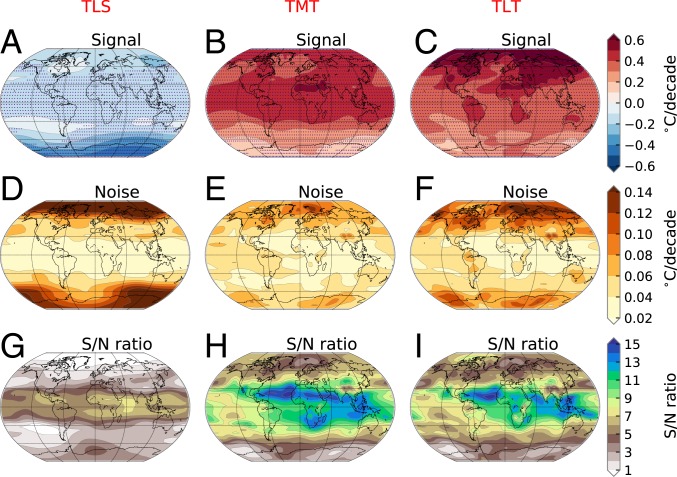
Fig. 3.
Signal, noise, and S/N ratios in the 50-member CanESM2 ALL LE. Results are for TLS (A, D, and G), TMT (B, E, and H), and TLT (C, F, and I). The signal (A–C) is the ensemble-mean trend in annual-mean atmospheric temperature over 1979 to 2018. The noise (D–F) is the standard deviation of the 50 individual temperature trends. G–I show the ratio between signal and noise. Stippling in A–C denotes grid points where S/N exceeds 2.

